
Does the SpaceX IPO Mark the “Top” for Tech?
The SpaceX IPO is going LIVE today. What’s going to happen next – and does the massive hype mark the “top” for the market? Find out inside.
Could the SpaceX IPO End the Pullback?
The pullback continues. But the question on people’s minds is – could the SpaceX IPO end the pullback? Ross investigates.
Could This Tech Selloff Spread to the Rest of the Market?
The tech selloff continues. Could it lead to a broader market selloff? Ross explores the situation inside.
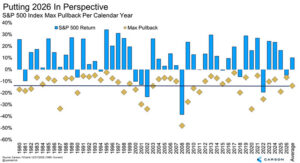
Pullback Perspective (Must Read)
Worried about the pullback? Then you need to read this as Ross’ provides valuable perspective on the whole thing.
Reasons Behind the Market Plunge
Last Friday delivered the worst day of 2026 for both the Nasdaq and S&P 500 — and the “good” jobs report may be a big reason why. Payrolls came in hotter than expected, rate-hike odds jumped, and the market finally snapped after a 9-week win streak. I’ll show you why this pullback may be healthy, why it doesn’t feel that way in real time, and how I’m preparing for the next wave of breakout opportunities.
The Smart Money Ramp Up
Hey, Ross here: Even as people continue to doubt this rally… The smart money keeps pouring in. Let’s take a look. Chart of the Day


Recent Comments