I mentioned in Monday’s Watchlist Update that I think the market is trying to form a bottom.
This isn’t an overnight process, and it’s going to take some time before we know for sure that the bottom is in.
However, it does seem that a few things have changed for the better in just the last few days.
We are seeing more positive signs out of the major market indexes, but we are also seeing several key changes in some of the other indicators we watch.
I’ll cover all of that and explain where I think the market goes from here in today’s issue…
Market Turnaround
Yesterday was a solidly bullish day for stocks, as the S&P 500 gained 2.8%, the Nasdaq jumped 3.1% and the Russell 2000 added 3.5%.
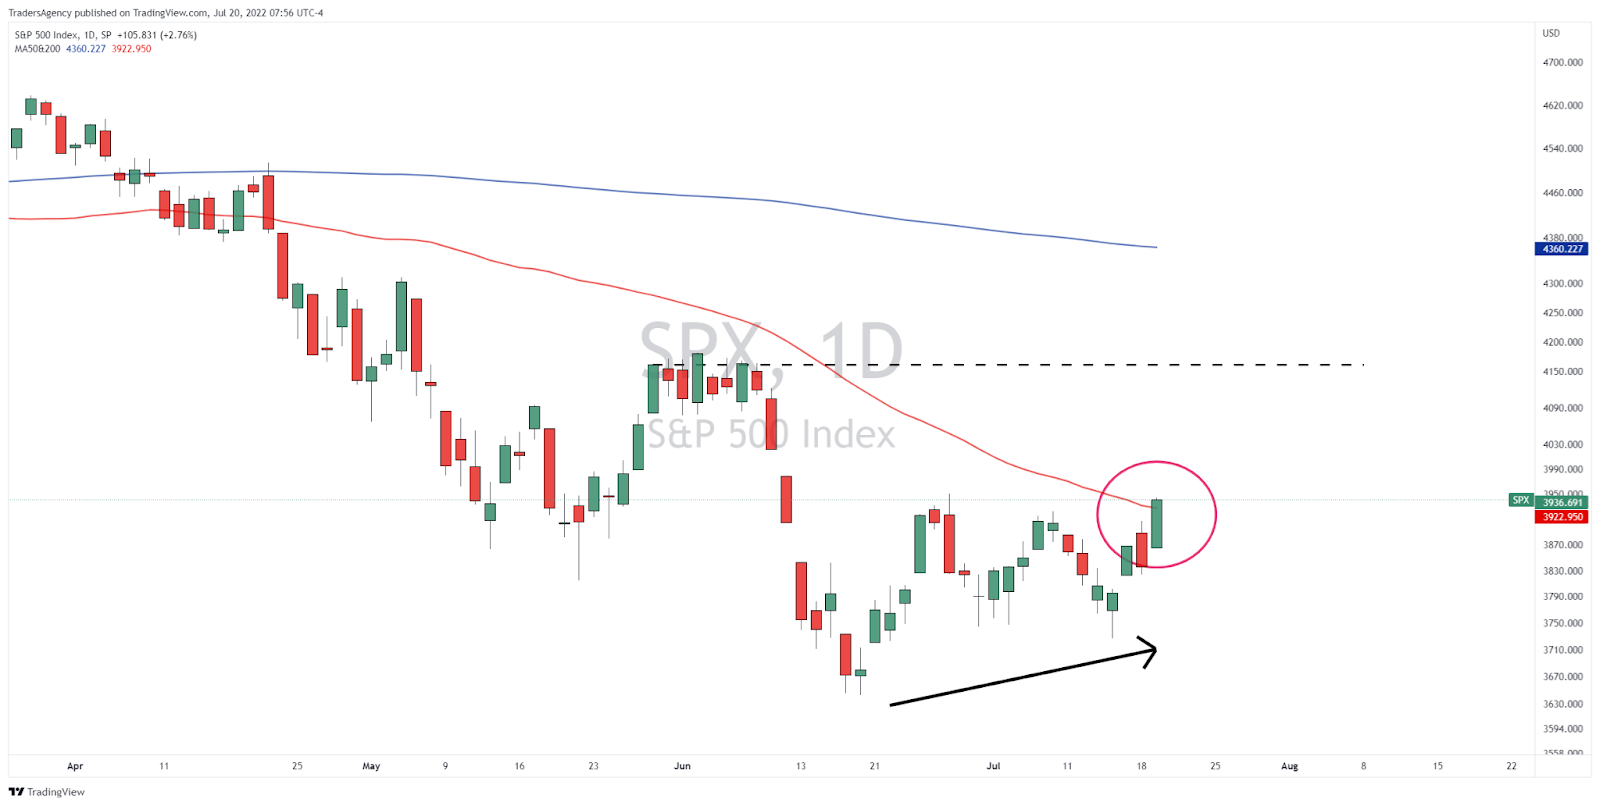
As you can see in the chart above, the S&P 500 has broken its pattern of making lower lows and lower highs this month.
On July 14, the S&P put in a higher low compared to the lower low that was set back on June 17.
This is the first sign of a potential change in direction that we have seen for the market all year.
The next test, however, will be seeing if the index can make a higher high somewhere above the early June consolidation range.
Reclaiming the 50-Day MA
Yesterday’s push was also enough to get each index above their respective 50-day moving averages (MAs)…
The 50-day moving average (red line on the chart above), while not as important to me as the 200-day moving average (blue line), is a key level for many traders.
As the market has stabilized over the past few weeks, the slope of the 50-day has started to flatten out a bit.
And if price can stay above the 50-day for several days, the slope should start to flatten further and eventually curl higher again.
If it does and the market continues to rally, this will turn into a key level of support to watch.
Of course, the 200-day moving average is still looming overhead at 4,360, but we’ll have to cross that bridge when we come to it.
Volatility Subsides
Next, I want to take a look at the S&P 500 Volatility Index (VIX). It seems to have fallen out of the news lately, but the action in this index can be quite telling.
As regular readers know, the VIX is referred to as the market’s “fear gauge.”
It’s typically inversely correlated with the S&P 500, so when the S&P 500 moves down, the VIX tends to move up, and vice versa.
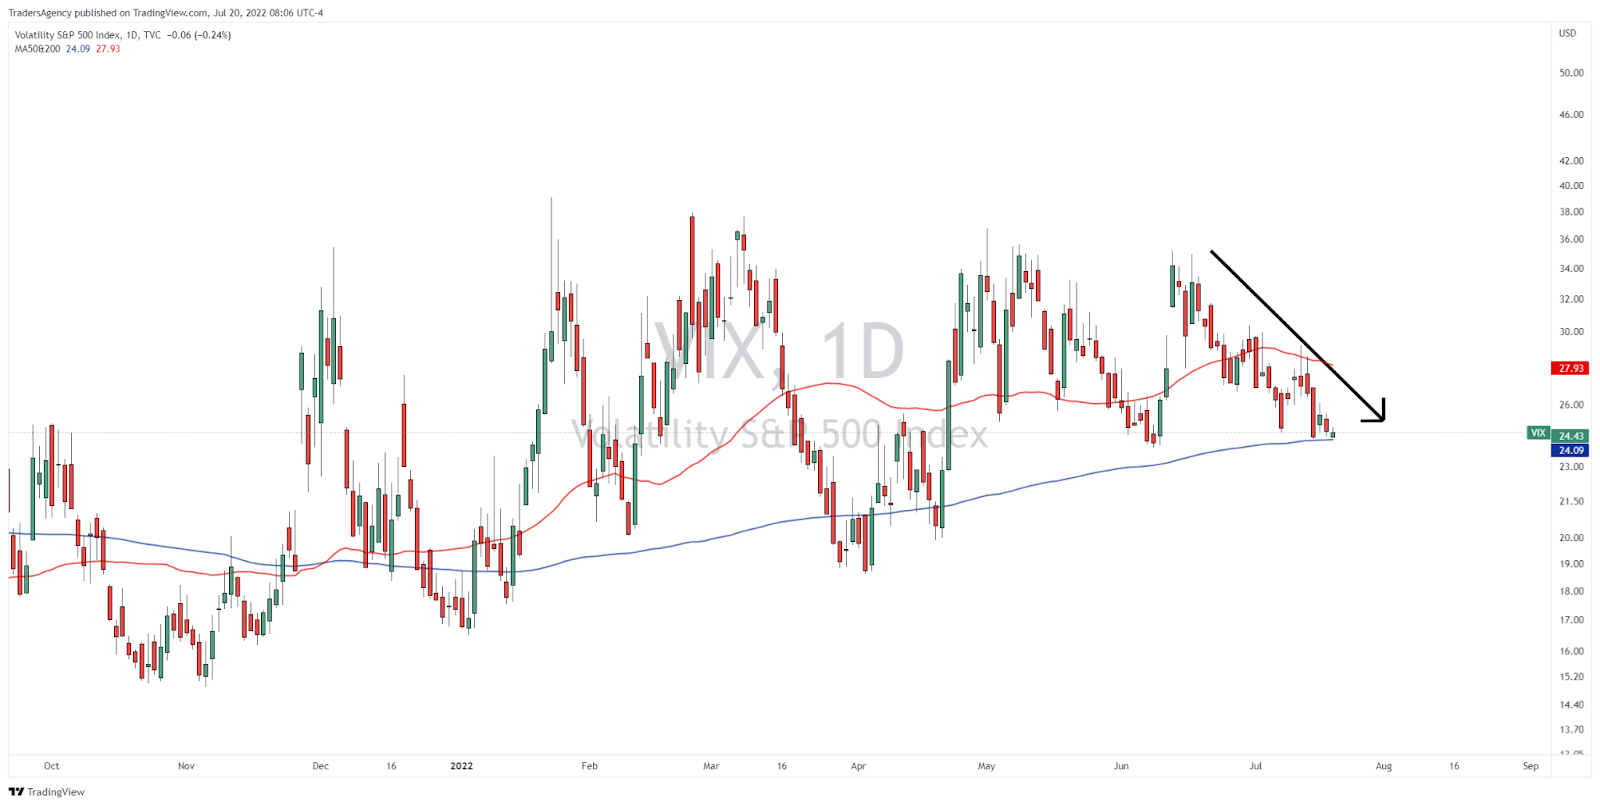
As you can see, the VIX has been trending slightly higher over the course of the year as the market has dropped.
It has continually jumped up to the 35 level or so each time there was a strong bearish push in the market, and each time it has been rejected so far.
Following the latest rejection, the VIX is now down by 31% from its recent high and sitting right on its 200-day moving average.
This level has acted as support in the past. But if the VIX can break this level, I would expect the bulls to have a much easier time pushing the stock market higher.
Ideally, we would like to see the VIX move into the mid to low teens to signal that traders are no longer as fearful about the market.
Market Breadth Still Weak
Lastly, let’s check in on one of our favorite market breadth indicators, which shows the percentage of S&P 500 stocks trading above their 200-day moving averages.
In early June, when the market was at its recent lows, the percentage of stocks above their 200-days was just above 10%.
Outside of the Great Recession and the pandemic bottom, this is one of the lowest readings we’ve seen in years.
And when the readings get that low, it generally turns out to be a long-term buying opportunity.
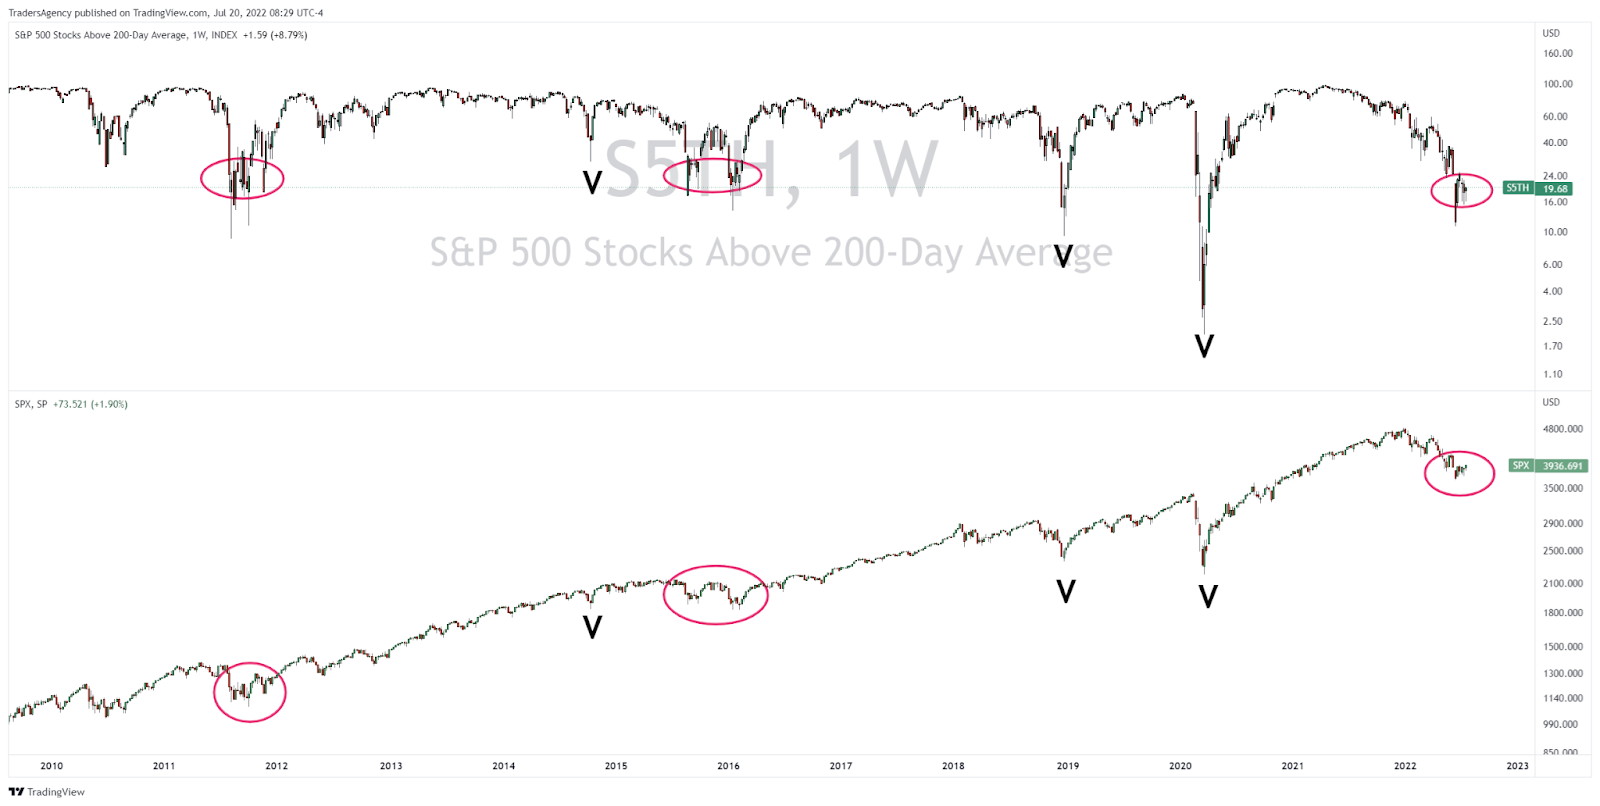
Sometimes, there is a quick “V-shaped” reversal in the market and the percentage starts to move higher again quickly.
This is basically what happened back in 2014, 2018 and 2020 (marked with “V” on the chart above).
However, we have not seen as much progress in this indicator lately. In fact, it’s been hovering in the teens or the low 20% range for the last six weeks, which looks a lot more like what happened in 2011 and 2015-2016.
Those bottoms took much longer to establish, and it’s starting to look more and more like that’s what could happen this time around.
Summing up, I do think the market is trying to put in a bottom. But as I mentioned at the start, this isn’t an overnight process.
Sure, it would be great to see a V-shaped reversal so we can put this bear market behind us. But the market doesn’t just go up and down…
We could very well be in for an extended period of sideways market action, which frankly is just fine for traders like us.
I’ll continue to keep you posted on these key market indicators as the situation progresses…
Ready for the Big Show?
Before I go, I need to invite you to a LIVE special event happening on TODAY at 12 p.m. ET…
My colleague and expert trader Josh Martinez is set to unveil his brand-new professional-grade system that virtually anyone can use with minimal upfront investments…
We’re talking as low as FIFTY BUCKS! You don’t want to miss this!
Click here to snag your seat for the main event happening TODAY at 12 p.m. ET.
I look forward to seeing you there!
Embrace the surge,

Ross Givens
Editor, Stock Surge Daily


