The S&P 500 had its first down week after a solid five-week advance, although it wasn’t much to write home about.
At this week’s low, the index wasn’t even down 2% from its all-time high.
And Friday’s 0.7% rebound brought the weekly loss back to only 0.3%.
The losses were a bit heavier for the Nasdaq, at 1%, and for the Russell 2000 small-caps, which fell 1.2%.
But overall, volatility has been low…
Even as headlines hype up fears of tapering (slowed bond-buying) and inflationary forces that recently showed up in consumer price data.
And that’s showing up in the S&P 500 Volatility Index (VIX) again, as we talked about a week ago.
At the time, we said that “the VIX has settled into the bottom of its range at the 15-16 area.”
Well, during this week’s retracement, the VIX tried to break out of that range but quickly failed at its overhead moving averages.
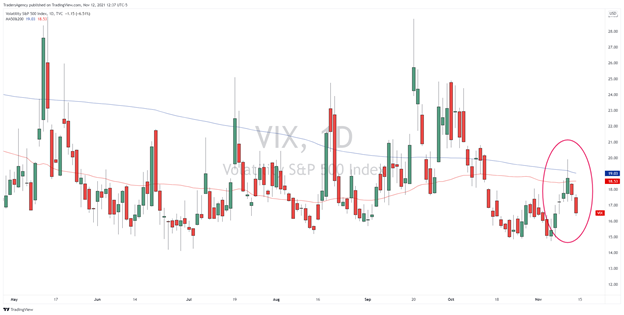
In the daily chart above, you can see how the VIX was never able to close above its 200-day moving average and only closed above its 50-day moving average for one session.
This was a good tell that the bulls were still in control of the market and that this week’s drawdown wouldn’t get too serious.
Now, before we get to this week’s Watchlist, if you’d like to learn more about the VIX and how to use options as a way to protect or grow your portfolio, read these articles on the Stock Surge Daily website:
And if you’re unsure of how to best take advantage of these weekly trades…
Be sure to check out my recent article, How to Follow My Weekly Trades, in which we walk step by step through how to know where I’m buying so that you can follow along.
Lightwave Logic, Inc.
Lightwave Logic, Inc. (LWLG) is a $1.4 billion company in the business of developing and selling proprietary electro-optic polymers that allow for higher speeds and better efficiency in transmitting data.
Here’s how the chart is setting up:
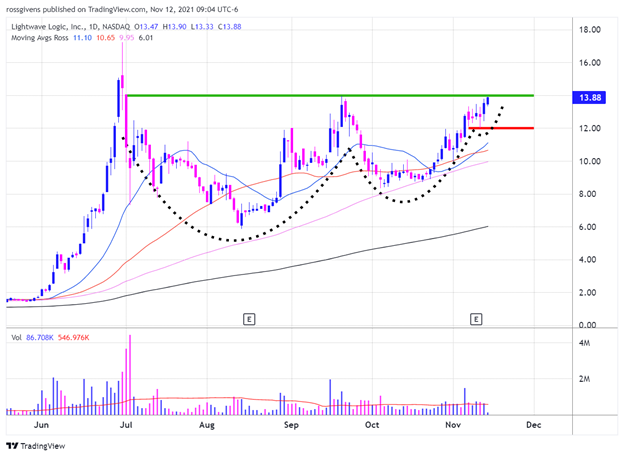
And here’s how the stock is setting up with my SSI:
- Surge score: 86/100
- % Above 52-wk low: 2,104%
- MFI reading: 79
- Sales growth: N/A
- Triple momentum: yes
From a technical perspective, LWLG has been an absolute monster in the second half of 2021.
Shares are up over 2,100% from their lows and could be on the cusp of a fresh break higher.
After a meteoric rise in June, shares began to consolidate in a classic compression pattern with resistance just below the $14 level.
The stock has been absorbing supply for the last week, so there should be minimal resistance once it breaks out.
A move above $14.00 will trigger me to buy.
North Shore Global Uranium Mining ETF
The $330 million North Shore Global Uranium Mining ETF (URNM) tracks a basket of uranium companies focused on mining, exploration, development and production.
It also includes companies that hold physical uranium or royalties and other non-mining assets.
The top 10 holdings make up about 75% of assets and include Cameco Corporation, Sprott Physical Gold Trust and Yellow Cake plc.
Here’s how the chart is setting up:

And here’s how the stock is setting up with my SSI:
- Surge score: 98/100
- % Above 52-wk low: 251%
- MFI reading: 60
- Sales growth: N/A
- Triple momentum: yes
I generally pick individual stocks over ETFs, but this set-up is extremely clean.
Three successively shallower dips have created a tight entry point on new highs above $104.00.
Most of the names in the uranium space have either already broken out or require a wider stop.
Uranium Energy Corp. (UEC), for example, broke out in late October, and the stock has already run 48.8% since then.
Ur-Energy Inc. (URG) is another uranium stock you could look at.
It trades for just $2 per share, which takes away some of the institutional buying power that could help propel the stock.
But the chart set-up is almost identical to URNM.
Academy Sports and Outdoors, Inc.
Academy Sports and Outdoors, Inc. (ASO) is the popular retailer of sporting goods and outdoor recreation gear, including camping, hunting and fishing equipment.
First founded in 1938, the company now has nearly 260 retail locations in 16 states and three distribution centers in Texas, Georgia and Tennessee.
Here’s how the chart is setting up:
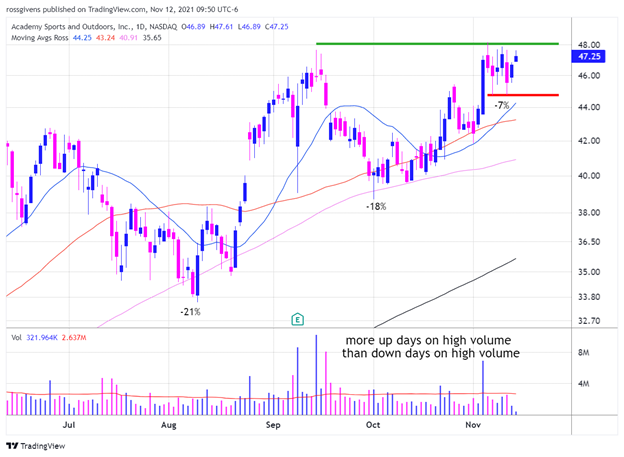
And here’s how the stock is setting up with my SSI:
- Surge score: 96/100
- % Above 52-wk low: 216%
- MFI reading: 64
- Sales growth: +12%
- Triple momentum: yes
Despite being around for as long as I can remember, ASO didn’t go public until last year.
The stock was immediately popular with investors who have shown a strong appetite for the shares.
ASO is up almost 4X in just over a year with no signs of slowing down.
And with a market cap of just $4.2 billion, I think it has plenty of room left to grow.
Sales and earnings are both growing at a healthy double-digit clip. The firm has also beat analyst estimates every quarter.
Volume looks healthy, and we are seeing more up days on volume than down – a good sign that the stock is still under institutional accumulation.
At the end of 2020, only 113 funds owned the stock. But as of September, that number grew to 390, and I suspect it is even higher today.
I’m looking to buy ASO on a new high above $48.20 with a stop at $44.70.
Lastly, don’t forget to check out my recent article, How to Follow My Weekly Trades if you’re new to Stock Surge Daily or just want a refresher.
Embrace the Surge,

Ross Givens
Editor, Stock Surge Daily


