Hey, Ross here:
And here’s a fascinating chart that lends evidence to the narrative that we’re in the early stages of a new secular bull market.
Chart of the Day
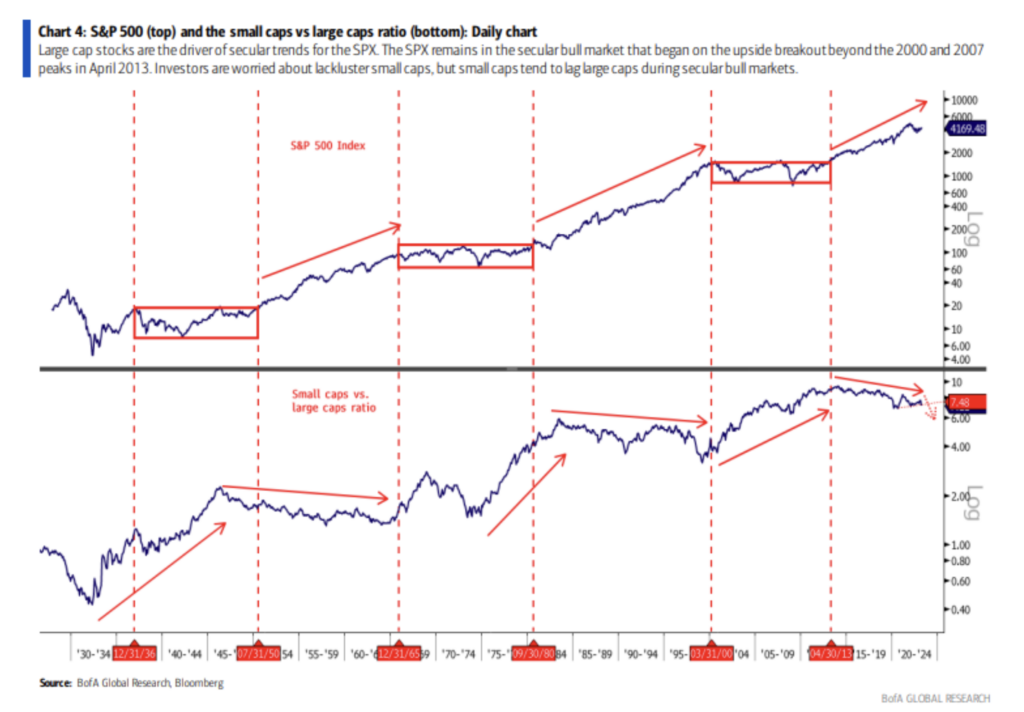
If you read the news, you know that a lot of the market’s recent performance has been driven by the biggest names.
Small-caps were (and still are) lagging the large caps – and this is a major point that’s being hammered over and over again by the bears. This is because small caps are often thought of as a leading indicator for the wider market.
Even I myself said earlier this year that for the market to really break through its resistance level that we need to see a lot more participation.
Today’s chart – which tracks the performance of small caps vs. large caps dating back almost 100 years – shows that the current underperformance in small caps is perhaps not as bearish as previously thought.
The chart shows that, during secular bull markets (seen in upward arrows on the top row), small caps do tend to lag large caps (as seen by the downward arrows in the bottom row).
In short, don’t let the negativity get you down. Large caps may be leading at the moment – but that may actually be a good sign.
P.S. Would you like special trade prospects and potential market moves sent directly to your phone? Text the word ross to 74121.
Insight of the Day
History – particularly long-term history – holds many valuable lessons for us as traders.
As traders with a focus on shorter-term profits, it can seem natural for us to discount long-term historical trends.
After all, why bother with what happened decades ago when we’re focused on making money now?
That kind of thinking causes us to miss a lot of opportunities.
As we just saw in the Chart of the Day, studying these long-term trends can indeed be very useful for traders.
The market moves in cycles – cycles that have constantly repeated themselves over the decades.
And it’s not only long-term trends that can help us uncover opportunities.
We should also study the methods used by traders “back then” to still make profits in the most challenging times in our history.
How do I know?
Because that’s exactly what I did.
And what I learned from studying the methods of these legendary traders allowed me to create one of my most powerful trading strategies ever.

Ross Givens
Editor, Stock Surge Daily


