Hey, Ross here:
The market is breaking out.
And as today’s chart shows – it’s not just a narrow slice of it.
Chart of the Day
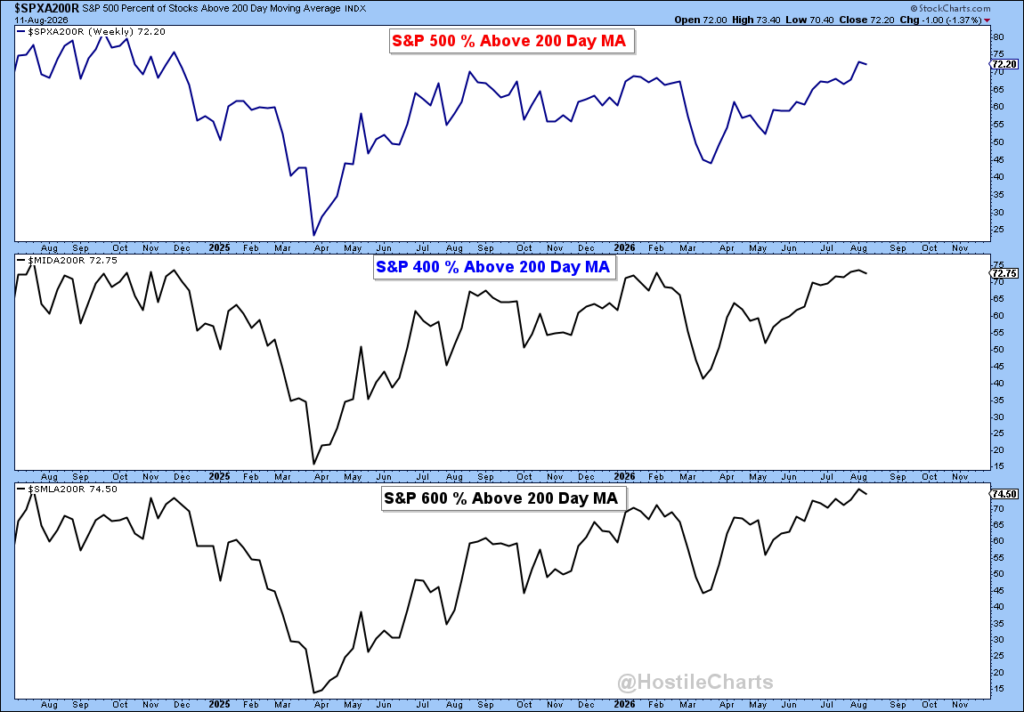
This chart tracks the percentage of stocks trading above their 200-day moving average – a sign of long-term direction.
Right now:
About 72% of S&P 500 stocks are above it.
Nearly 73% of S&P 400 mid caps are above it.
And roughly 75% of S&P 600 small caps are above it.
All three are sitting around their highest levels of the year.
That’s exactly what I want to see in a healthy rally.
We’re not relying on just a few mega-cap stocks – or even sectors – anymore.
Strength is spreading across the market.
And this next chart gives us a good clue as to why.
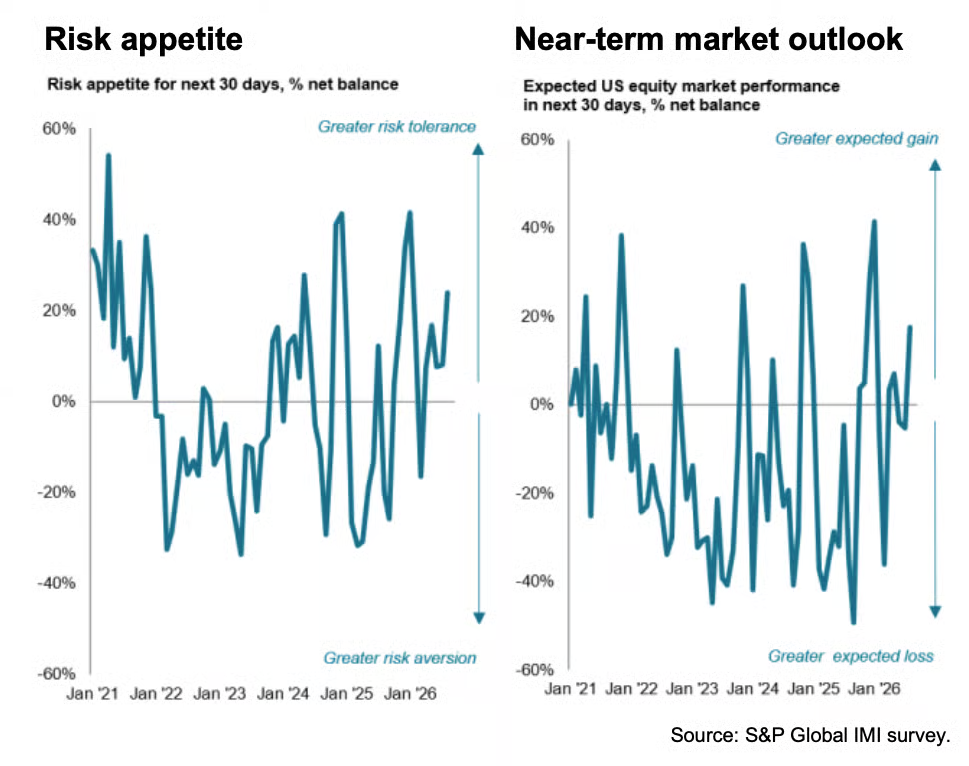
S&P Global surveys nearly 300 institutional investors managing more than $3.5 trillion.
In August, their risk appetite jumped sharply.
So did their outlook for U.S. stocks over the next 30 days.
In fact, the headline Investment Manager Index is now at its most bullish level since January.
Big money is getting more comfortable taking risk.
And we can see that buying spreading into large caps, mid caps and small caps at the same time.
For traders, that means the number of potential breakout candidates is growing fast.
But there’s one distinction you need to make.
I explain below.
Insight of the Day
A breakout is not the same thing as a breakout setup.
In a market like this, breakouts start showing up everywhere.
That’s when traders get themselves into trouble.
They see a stock rip through an old high…
Jump in after it…
Then wonder why it stalls or snaps right back.
The mistake is focusing only on the breakout itself.
I care much more about what the stock was doing before it broke out.
Was it tightening up?
Were sellers getting weaker?
Was the stock holding near its highs instead of giving back the move?
Was there a clear level where buyers could finally take control?
Those are the kinds of things that tell you whether a breakout has been building for a while…
Or whether you’re just chasing a stock that already ran.
And with breadth this strong, we’re going to see plenty of stocks hit new highs.
I don’t want all of them.
I want the ones forming the right setup first.
And there’s one pattern in particular I pay very close attention to…
Because it’s the best way I know to target these explosive breakouts before they happen.
It’s been used by some of the best traders in the world, including multiple U.S. Investing Champions…
And it’s been ranked the #1 chart pattern for finding explosive breakout moves.
Later today at 3 p.m. Eastern, I’m going LIVE to show you exactly what it looks like…
How I spot it before the breakout happens…
And the mistakes that can turn a great-looking setup into a lousy trade.
This same strategy has signaled moves of:
163% in seven weeks…
177% in 11 days…
And even 148% in just two days.
I’ll also reveal the name and ticker of a stock forming this pattern right now.
With more stocks breaking out across the market, this is exactly the kind of setup I want on my radar.
Click here to lock in your free seat if you haven’t already…
And I’ll see you LIVE today at 3 p.m. ET.
P.S. If you’re planning to attend on a mobile device, make sure you download the presentation app now so you don’t miss anything when it starts. See you there.
iOS: https://apps.apple.com/us/app/goto/id1465614785
Android: https://play.google.com/store/search?q=goto&c=apps
Customer Story of the Day
“Best service available, and I have tried them all.
Ross is the only one who spends his time trying to TEACH you how to do it rather than telling you buy this sell that.
It’s like the old saying, “Give a man a fish you feed him for a day, Teach a man to fish, you feed him for life.”
As a lifetime private trading club member I would Highly, Highly recommend TA to anybody, and I have recommended it to several of my friends and family.”

Ross Givens
Editor, Stock Surge Daily