Stocks are picking up August where July left off, as the markets are rallying further this week.
Technology stocks are leading the way higher, with the Nasdaq 100 jumping 2.8%, the S&P 500 up 0.5% and the Russell 2000 higher by 1.3%.
Some of this may have to do with the decline in the price of crude oil – down over 10% this week alone – and the perceived cooling of inflationary pressures…
But is this the real deal or just a “bear trap” waiting to ensnare unsuspecting traders?
That’s what we’ll try to figure out today…
Taking the Market’s Temperature
First, let’s look at the three major stock indexes I mentioned above and see how they are setting up…
Each index is up 15% or more from its recent low and has cleared its 50-day moving average (not pictured), which is a great sign.
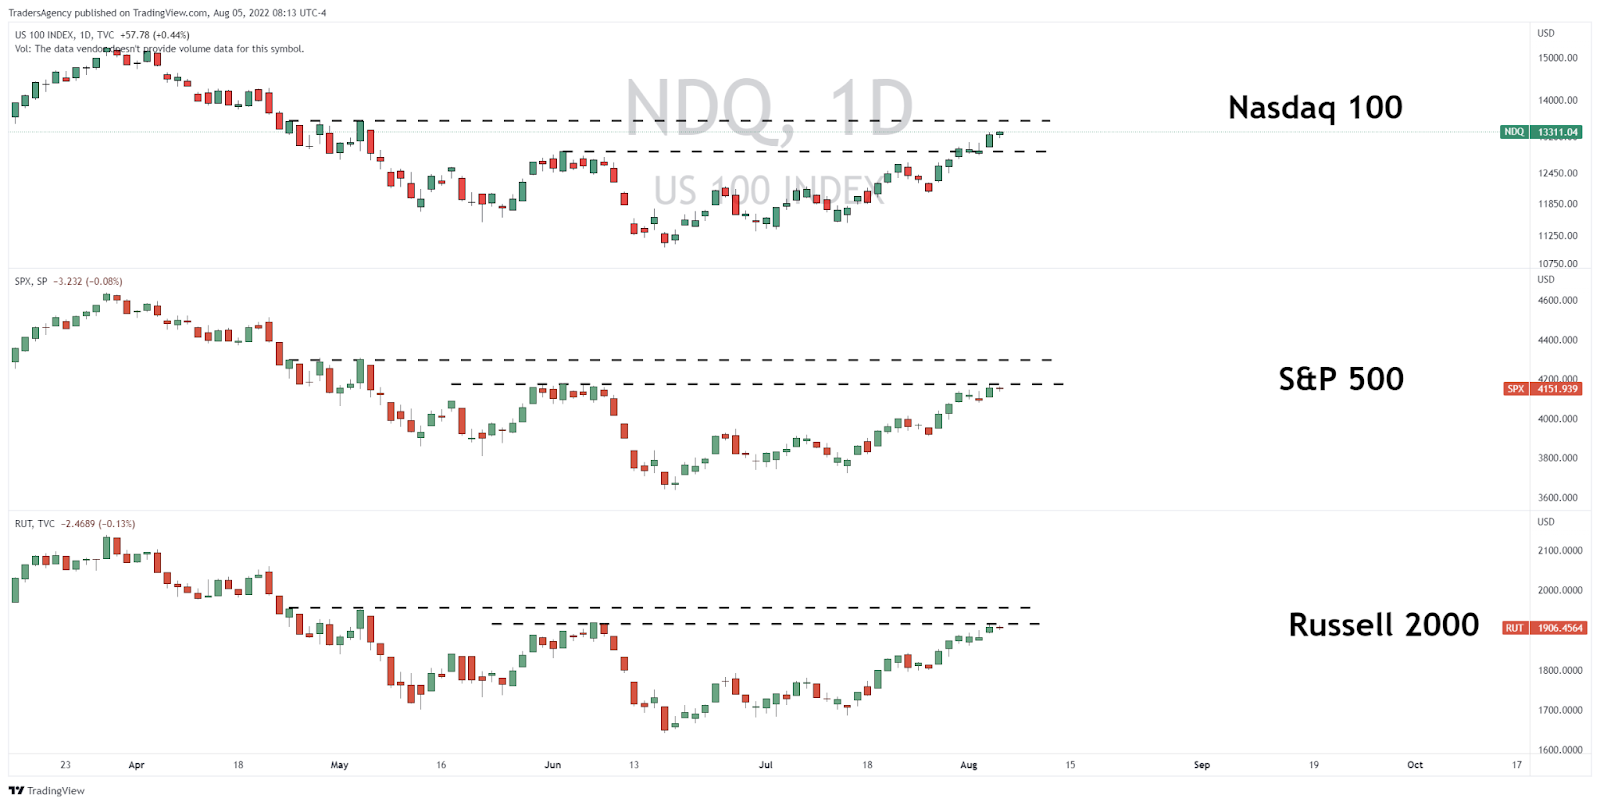
However, none of these markets have yet to overcome their 200-day moving averages (not pictured).
Furthermore, each index will likely face a test of overhead resistance soon.
The Nasdaq has made it through the short-term resistance level formed by the early June consolidation, but there is still another resistance level overhead from a key level in late April.
The S&P and Russell are still stuck below both levels, so I would like to see the bulls make further progress there.
Moving Up
Now, speaking of moving averages, let’s check in on the percentage of stocks trading above their 200-day moving averages.
I mentioned in a recent article that because the percentage of stocks above their 200-days was sitting in a range for a few weeks (circled on the chart below), it could be a sign that the market will consolidate for a while longer.
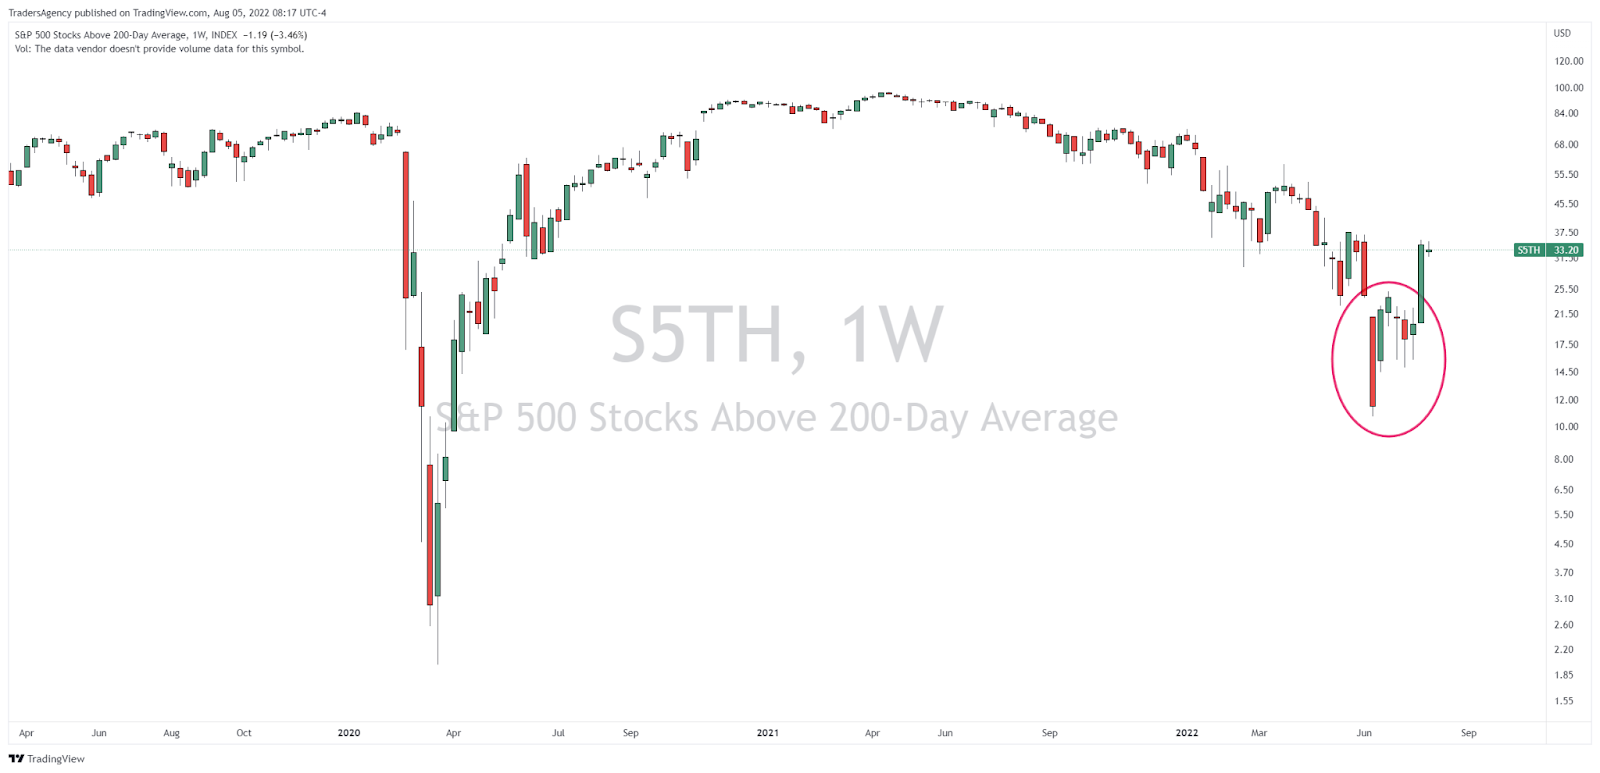
However, the percentage reading has now spiked out of that range and is back to the 33% area.
It may take a while for different areas of the market to fully recover and push this reading back up into a bull-market range of 50% and higher, but this is a good sign that has already started.
Breaking Down
Lastly, I want to take a look at the S&P 500 Volatility Index (VIX), which is often referred to as the market’s “fear gauge.”
It’s typically inversely correlated with the S&P 500, so when the S&P moves down, the VIX tends to move up, and vice versa.
And right now, it’s giving me a lot of confidence in the current market rally…
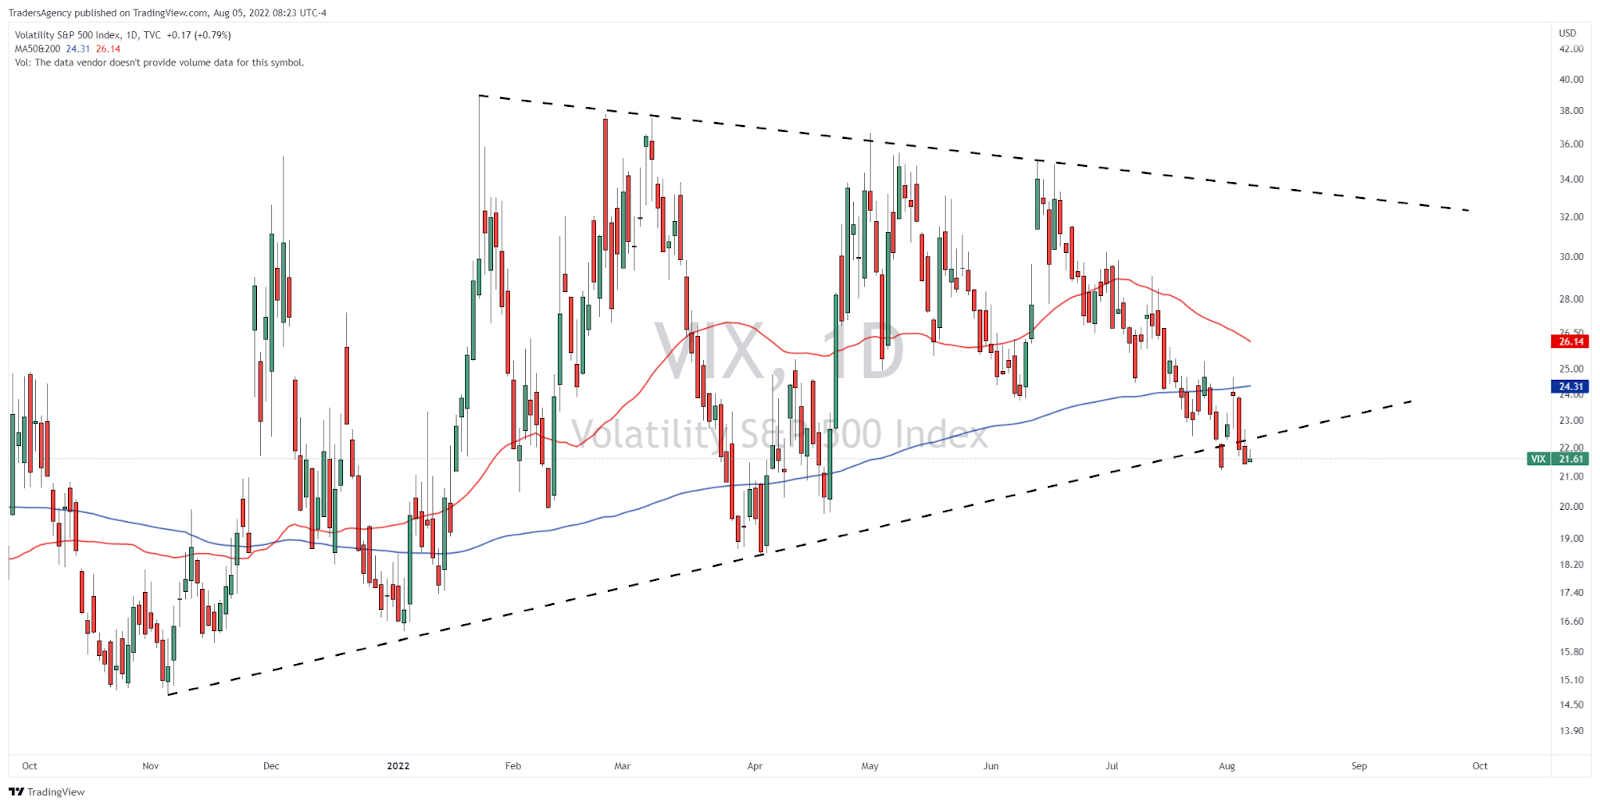
As you can see, it has been trending slightly higher over the course of the year as the market has dropped.
However, it just broke down below its up trending support level for the second time in two weeks.
It has also fully broken down below its 200-day moving average (blue line). And when it tried to test that level from the underside on Aug. 3, the VIX was quickly pushed back down.
From here, I would eventually like to see the 50-day moving average (red line) cross below the 200-day and see the VIX make a lower low compared to the low in April.
Ideally, I would like to see the VIX move into the mid- to low teens to signal that traders are no longer as fearful about the market.
Insiders Lead the Way
Now, if you want a strategy for getting ahead of big market moves before they happen, consider this…
When corporate insiders like CEOs, CFOs, executives and board members put down their own hard-earned money to buy shares of their own companies, it’s a huge vote of confidence.
After all, these folks have a footing of knowledge about their companies that Main Street investors simply do not.
It’s absolutely free to attend, so I really hope you’ll check it out.
I’ll cover my strategy for trading alongside corporate insiders and generating potentially massive gains with less risk.
Just click here to register for this special Insider Effect LIVE session now!
Embrace the surge,

Ross Givens
Editor, Stock Surge Daily


