As regular readers know, there is a wide variety of different price patterns that can form over short- or long-term time frames.
They can be bullish or bearish, and they can signal either a continuation or a reversal of the current trend.
But today, we’re going to continue our discussion of individual market candlesticks and the meaning behind them.
I’ve just seen one of these candlestick patterns develop on the chart of the S&P 500 index, so let’s take a look and see what it may mean for prices going forward.
Wild CPI Swing
Think back to a few weeks ago to what happened after the September consumer price index (CPI) reading was released…
On the morning of Oct. 13, the CPI report showed that inflation is still running at an annual pace of over 8%.
Initially, this caused a big drop in the market early on in the trading day.
However, by the end of the day, the S&P 500 and the other major indexes ended higher by over 2%.
This was one of the biggest intraday reversals in recent memory.
And as of this writing in early November, the Oct. 13 low is still the low of the year…
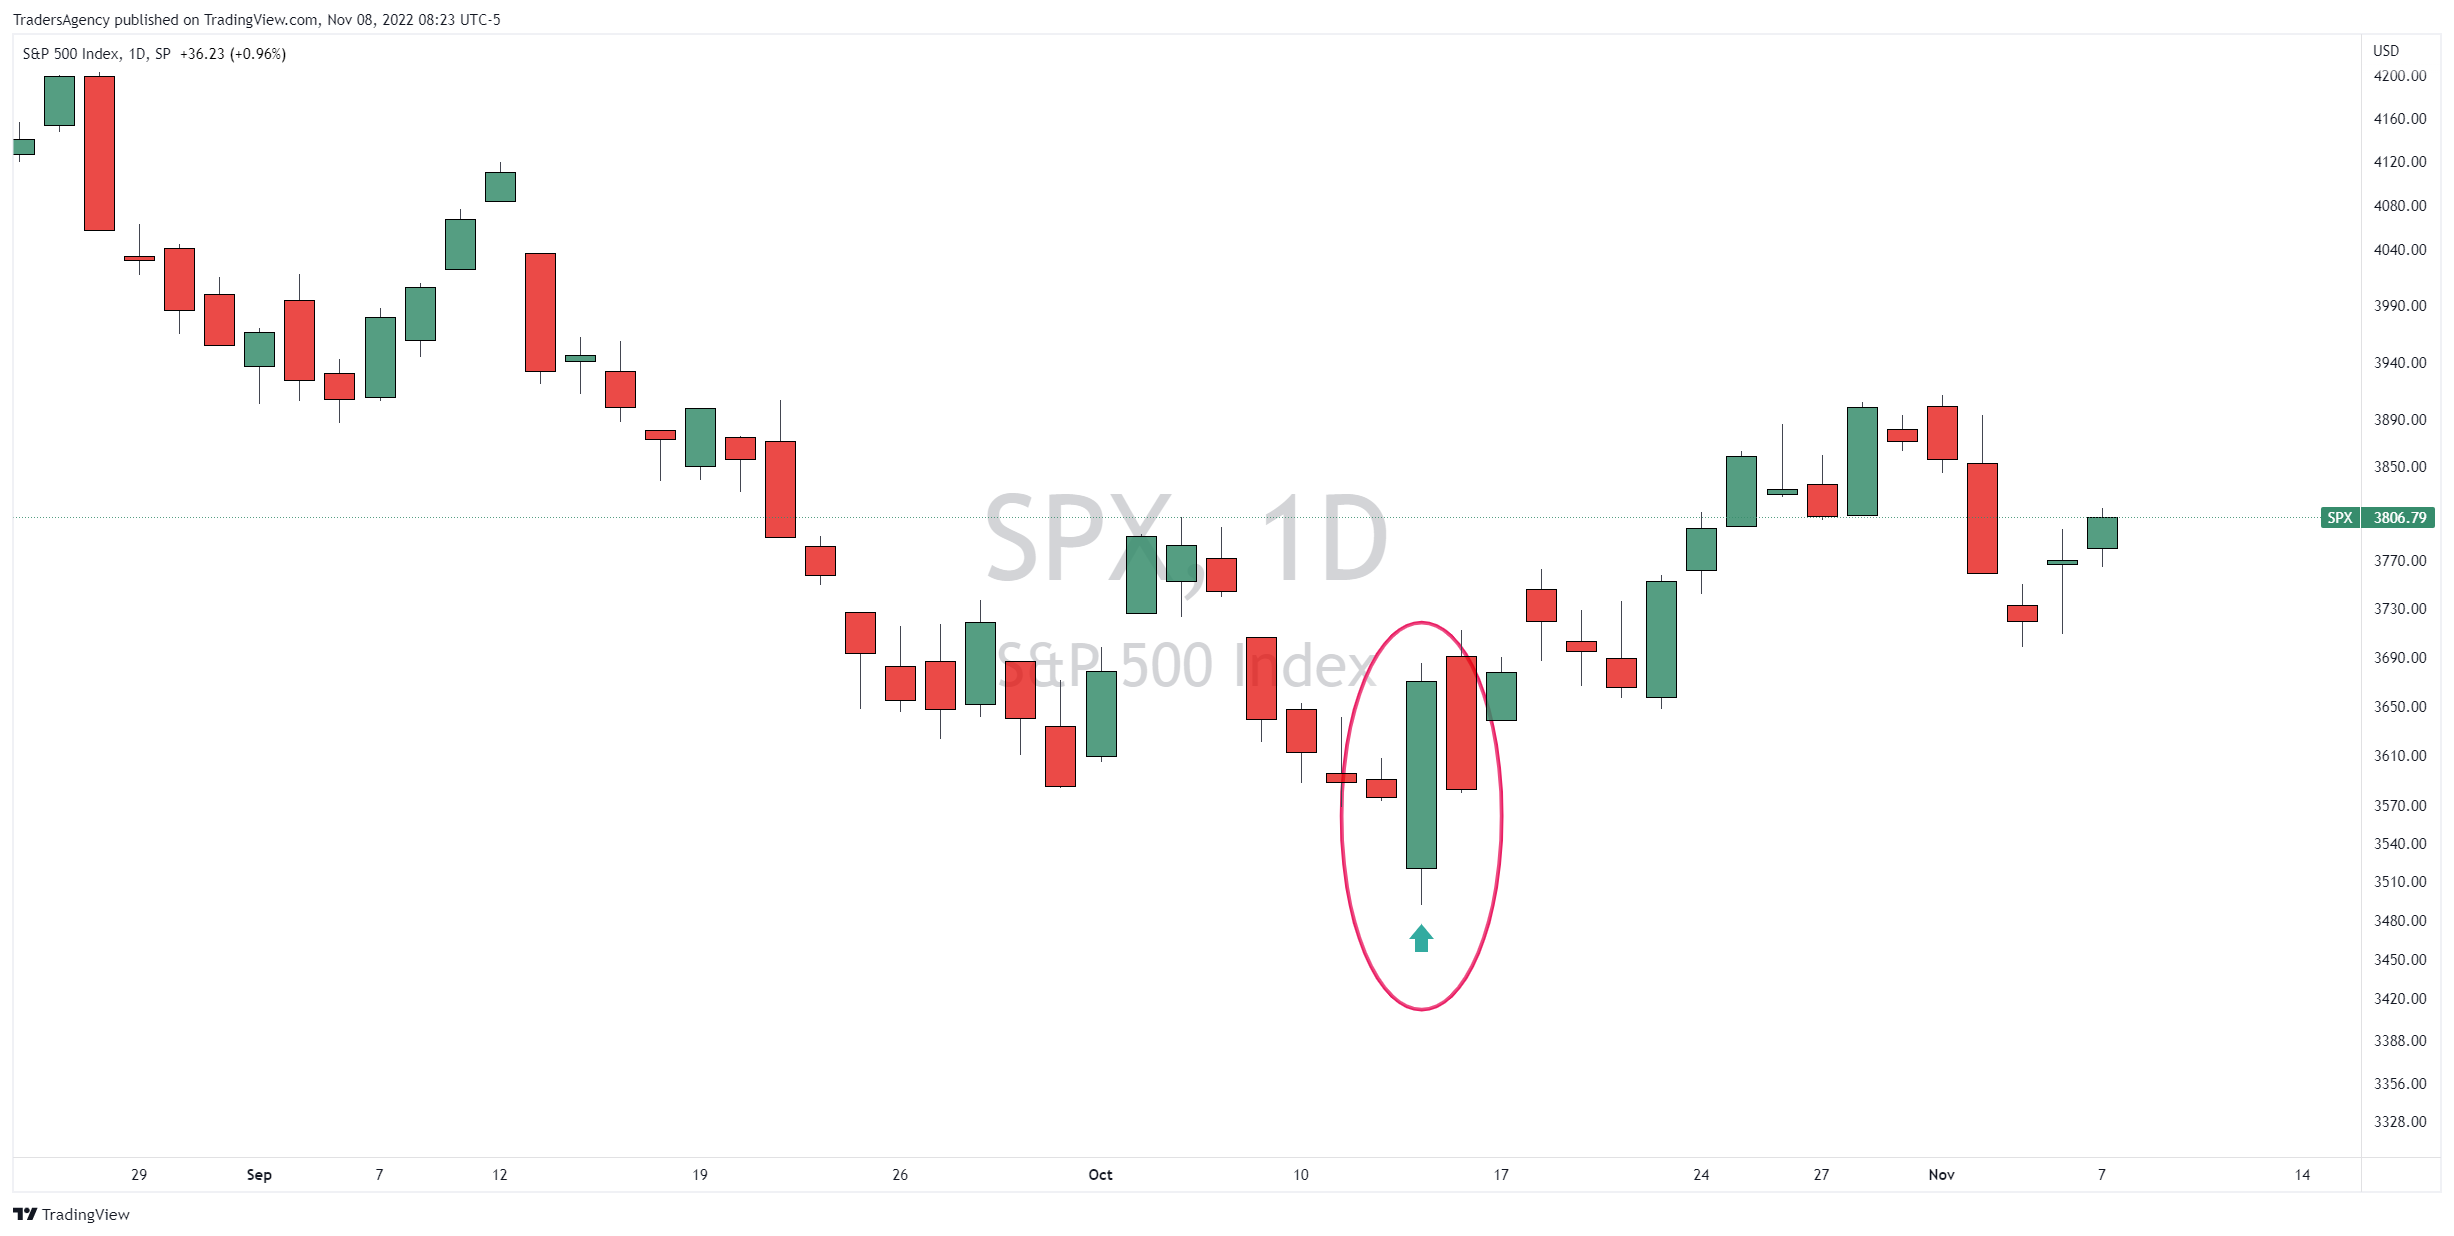
In the daily chart of the S&P 500 above, I’ve circled the Oct. 13 candlestick that developed in the aftermath of the CPI release.
Bullish Engulfing Candlestick
What you’ll notice is that this tall, green candle opened lower than the previous day’s low, and it closed higher than the previous day’s high.
This is what’s known as a “bullish engulfing” candlestick pattern.
And the reason it is significant is that it represents not only a price reversal but a change in control from the bears to the bulls.
For the engulfing candle to open lower than the previous day’s close, it must experience a gap down at the open.
That’s exactly what happened after the scary CPI number was released… The S&P gapped down and opened about 1.5% lower than the prior day’s low.
Of course, that shows that the bears were in charge at the open that day.
But for the engulfing candle to close higher than the previous day’s high, it must experience a big rally into the close of trading.
That’s also what occurred in this case, as the bulls took over throughout the session and closed the market 1.7% higher than the prior day’s high.
Shifting Control
Here’s what that intraday action looks like on a five-minute chart…
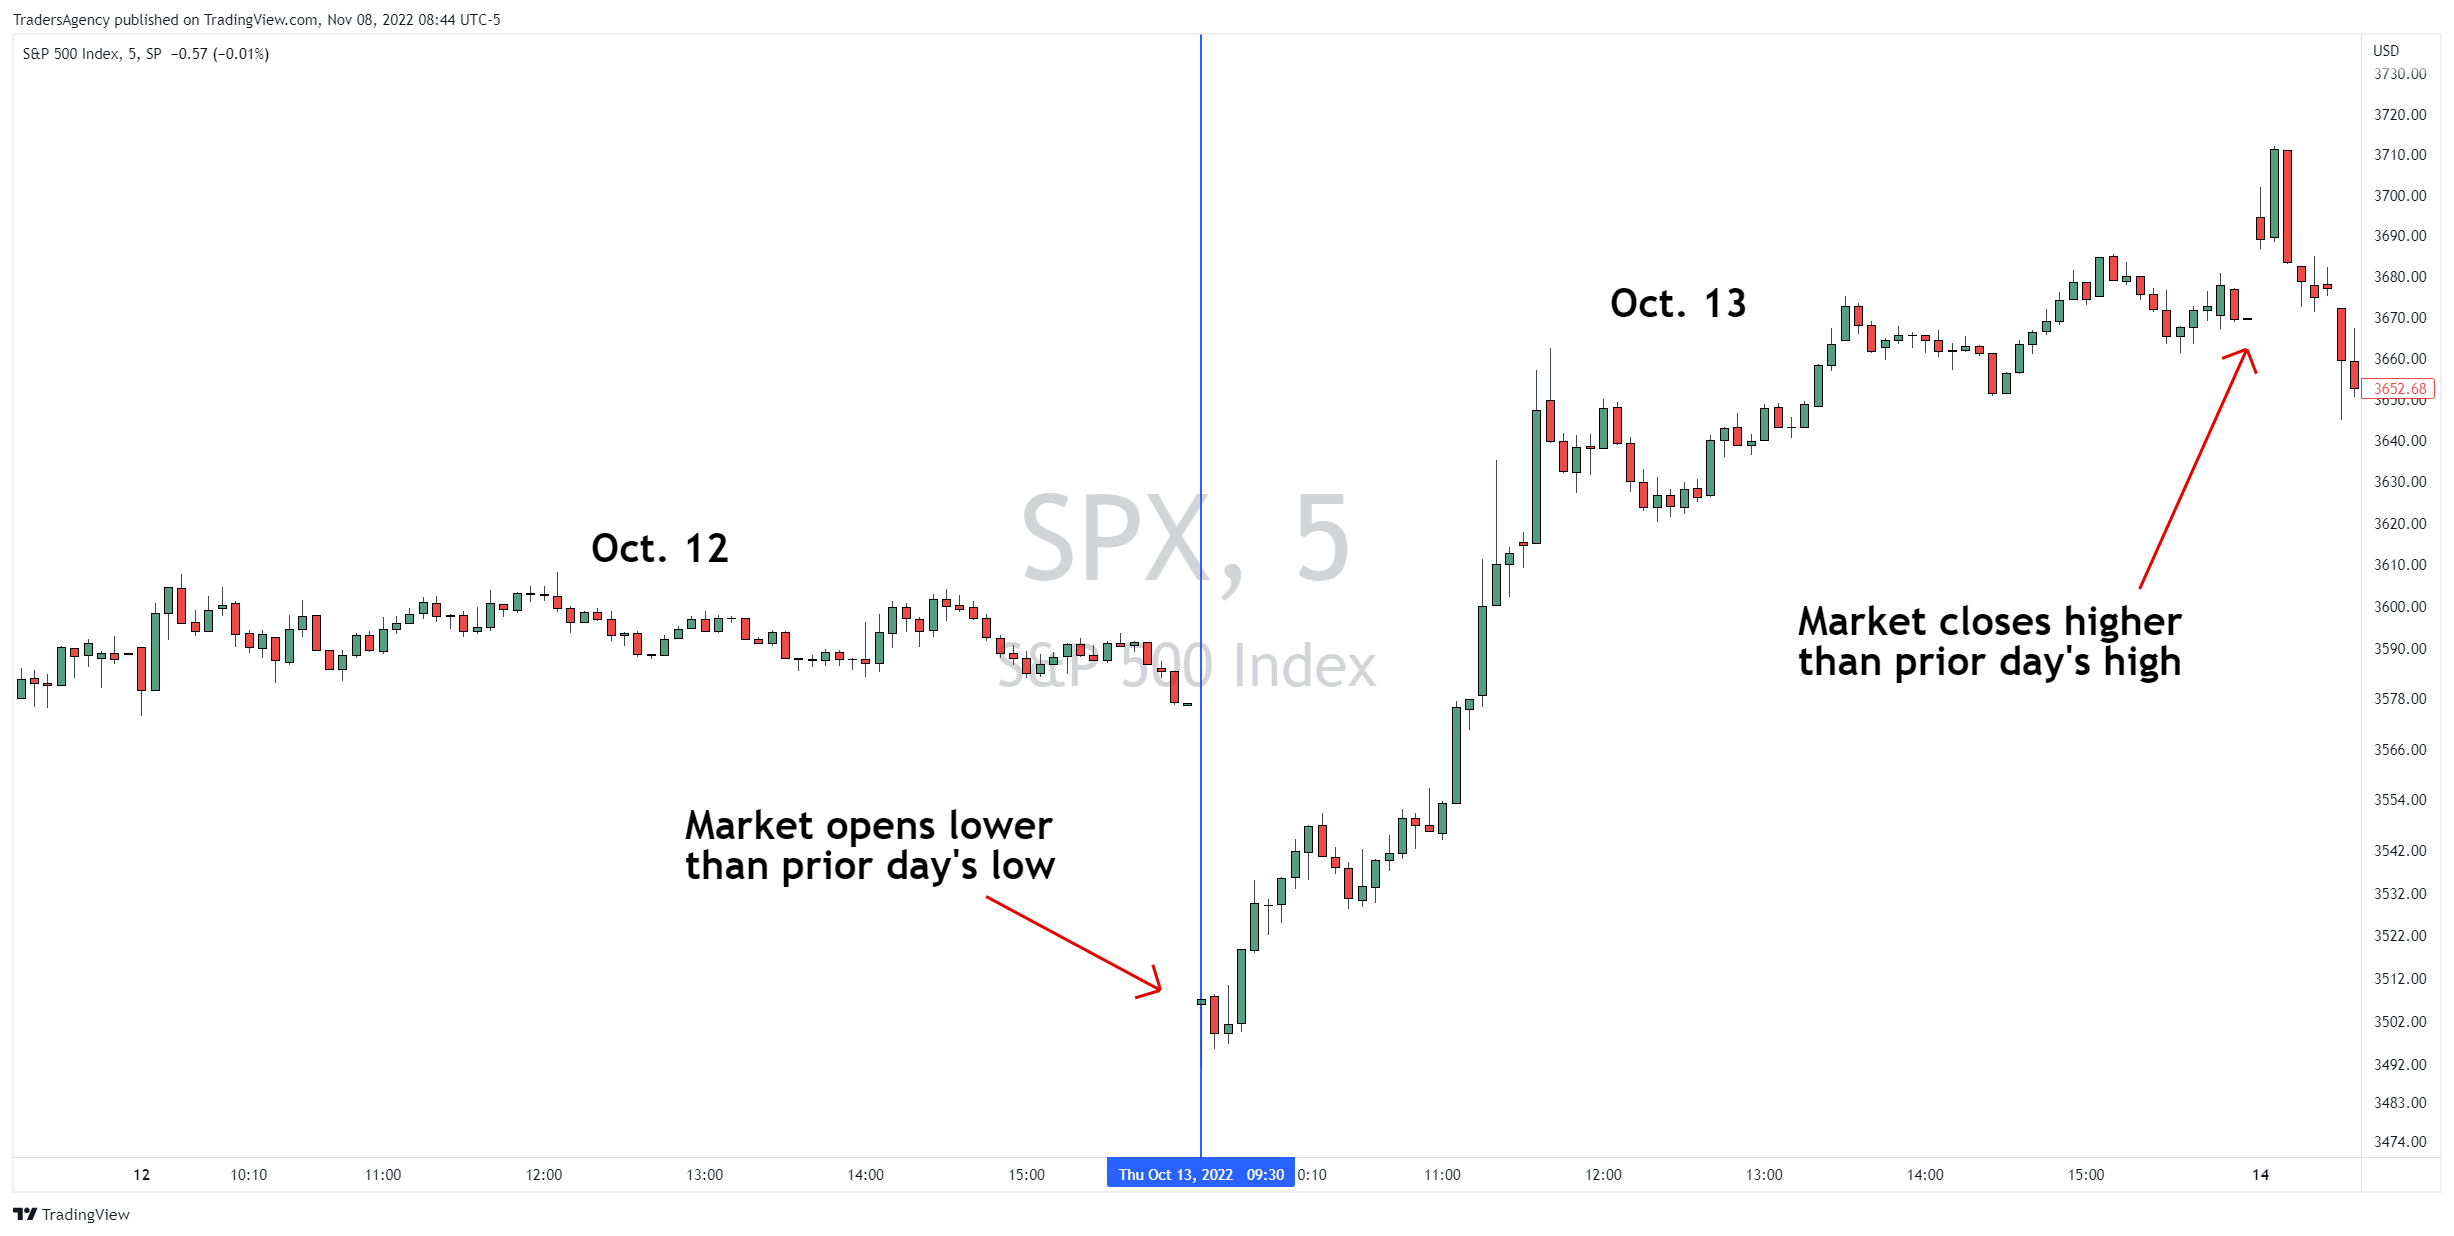
What this shows is that while the bears were in control in pre-market trading, the bulls took over during regular market hours and were in control at the end of the day.
A bullish engulfing pattern is typically considered to be a trend reversal pattern. That held true in this case, as the S&P rallied as much as 12% from the Oct. 13 low.
However, like everything in the market, there are no guarantees that the bulls will maintain control going forward.
What’s important is that traders recognize the intraday power shift from the bears to the bulls, which should at least cause traders to think twice about betting on further downside in the near term.
My Latest Research Project
Regular readers know I have years of experience following the stock trades of corporate insiders, but I’m now looking for even bigger gains by following the insiders in Washington DC.
We all know that those in power are making millions with their uncanny knack for buying into stocks ahead of massive moves.
It’s enough to make you think that the system is tilted against the individual investor.
But not to worry… There are legal ways to follow these transactions by DC insiders without ever being accused of insider trading…
My brand new Undercover Trader research service focuses on exactly that, and I’ve just put the finishing touches on my latest presentation.
Embrace the surge,

Ross Givens
Editor, Stock Surge Daily


