As traders, it’s important to remember that we cannot control the market.
The market has a mind of its own, and it’s never going to do exactly what we expect it to.
The only thing we can really do is go with the flow of what we’re seeing and react to it as best as possible.
So today, I want to show you the roadmap ahead now that the market is back at its June lows…
Path of Least Resistance?
The S&P 500 Index set a new 2022 low yesterday at 3,623.29 as the bears tried to break through the June lows.
While the bulls held that level for now, I still see that the path of least resistance for this market is to the downside.
But keep in mind that the S&P and the other indexes are extremely oversold…
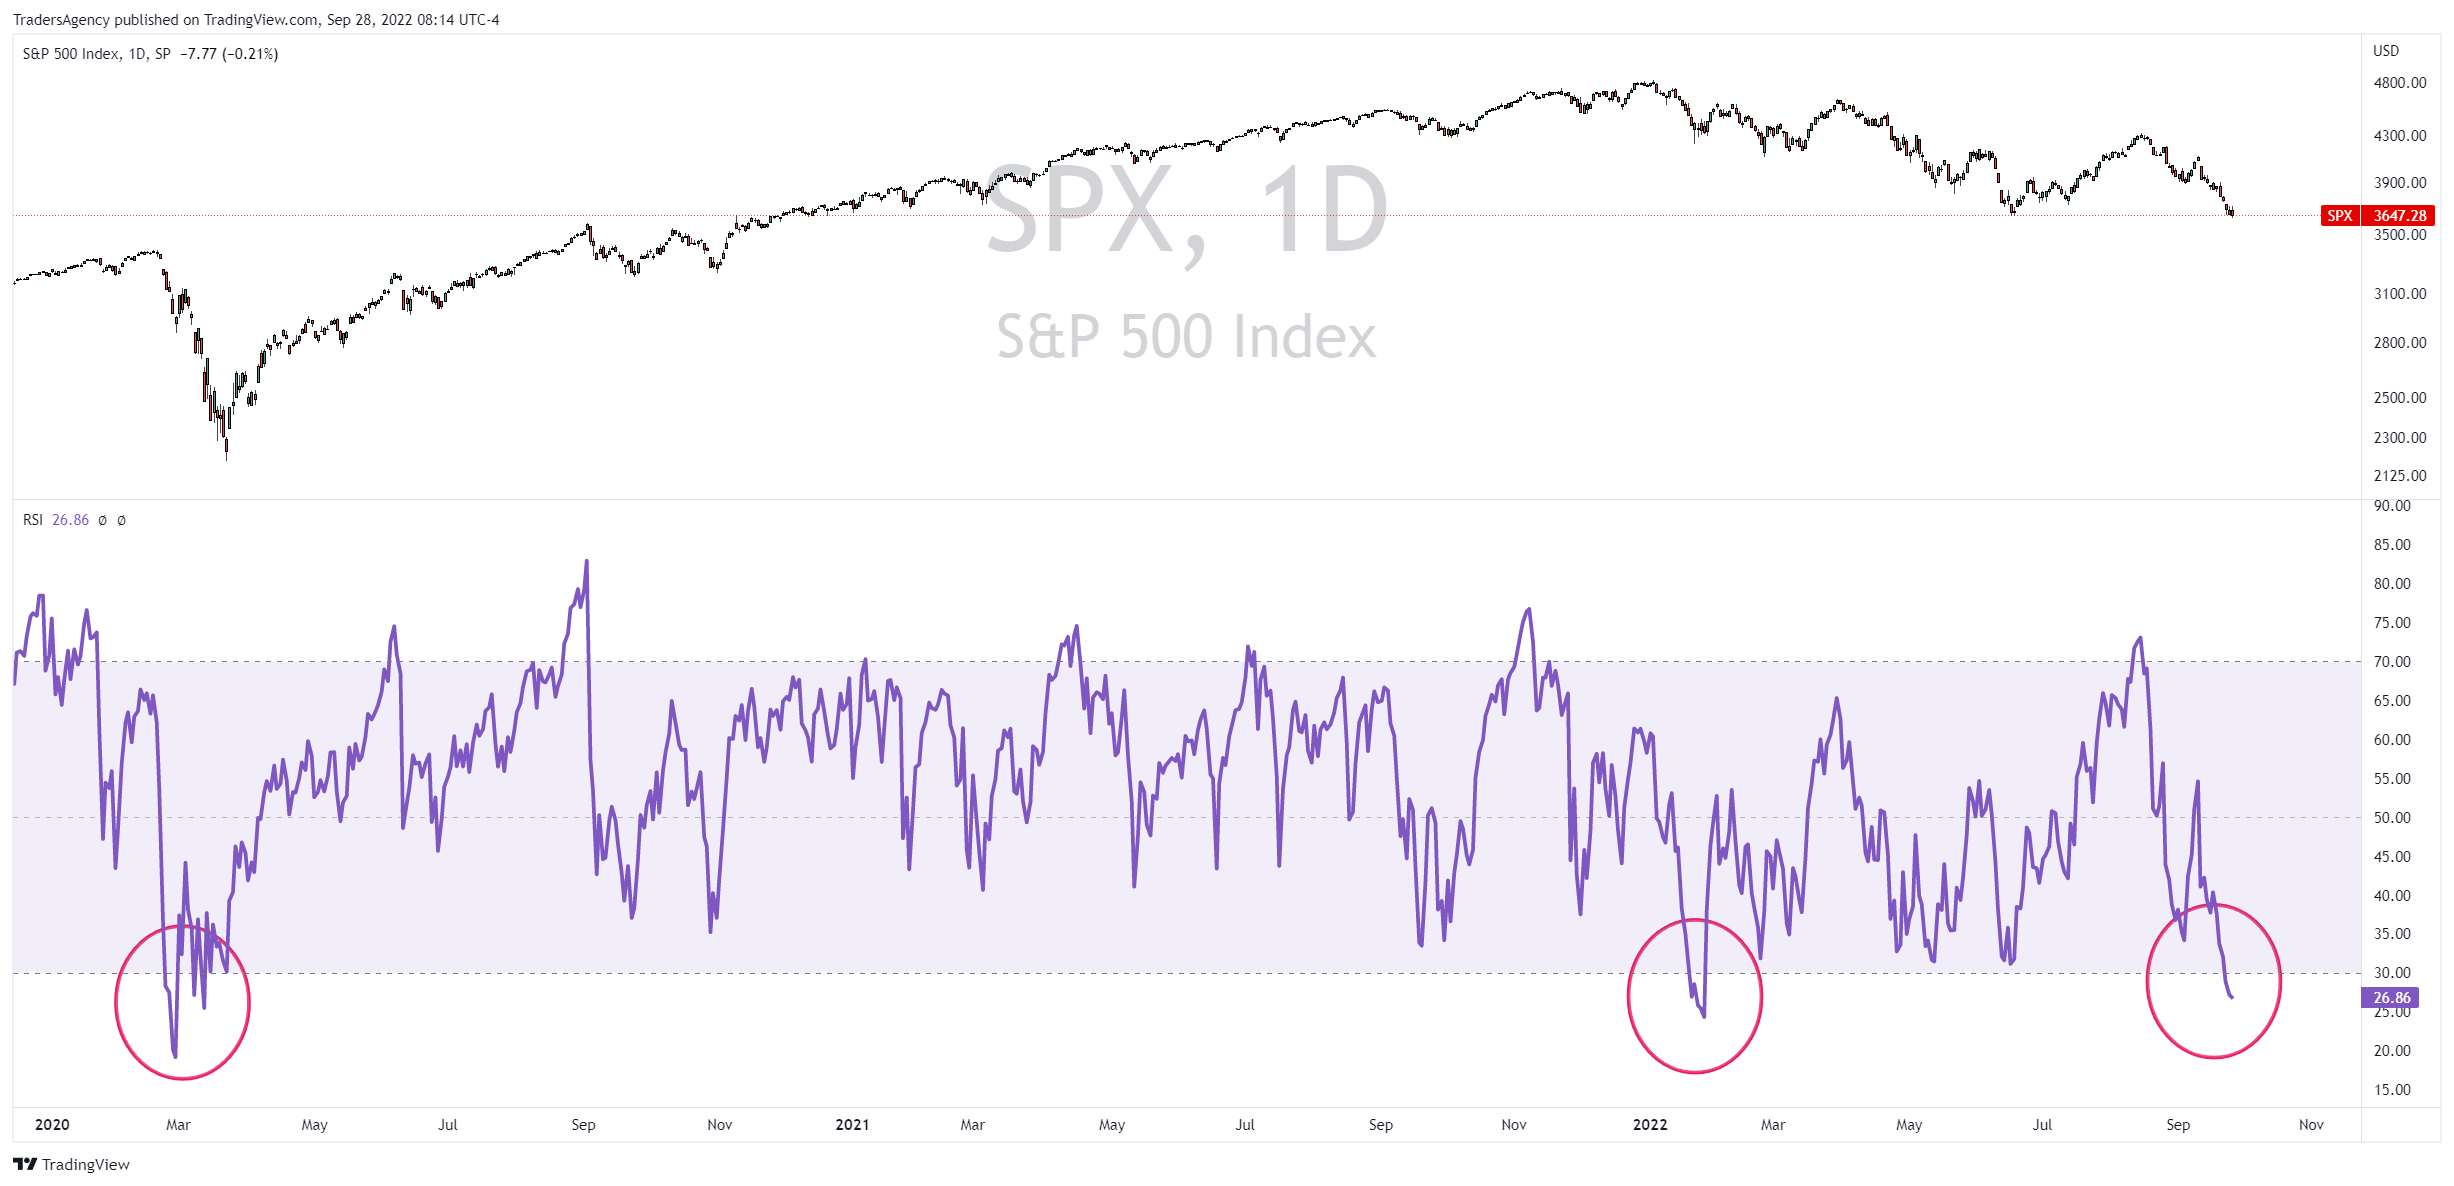
In the daily chart of the S&P above, you can see the relative strength index (RSI) indicator in the bottom panel of the chart.
It has now fallen to one of the lowest points in the last three years.
The only other instances the RSI reading fell below 30 during that time period were during the initial plunge at the start of this year…
And before that, at the start of the pandemic panic in 2020.
Downside Not Done
Now, when the RSI gets down to such low levels, it can sometimes be a contrarian indicator.
In other words, a very low reading might indicate that the sellers have overdone it to the downside, presenting an attractive opportunity for buyers.
And if the buyers were going to come into the market, now would certainly be the time to make a stand at the June lows.
However, I’d expect any bounce to be very short term.
To see what I mean, take a look at this chart I drew up over the weekend…
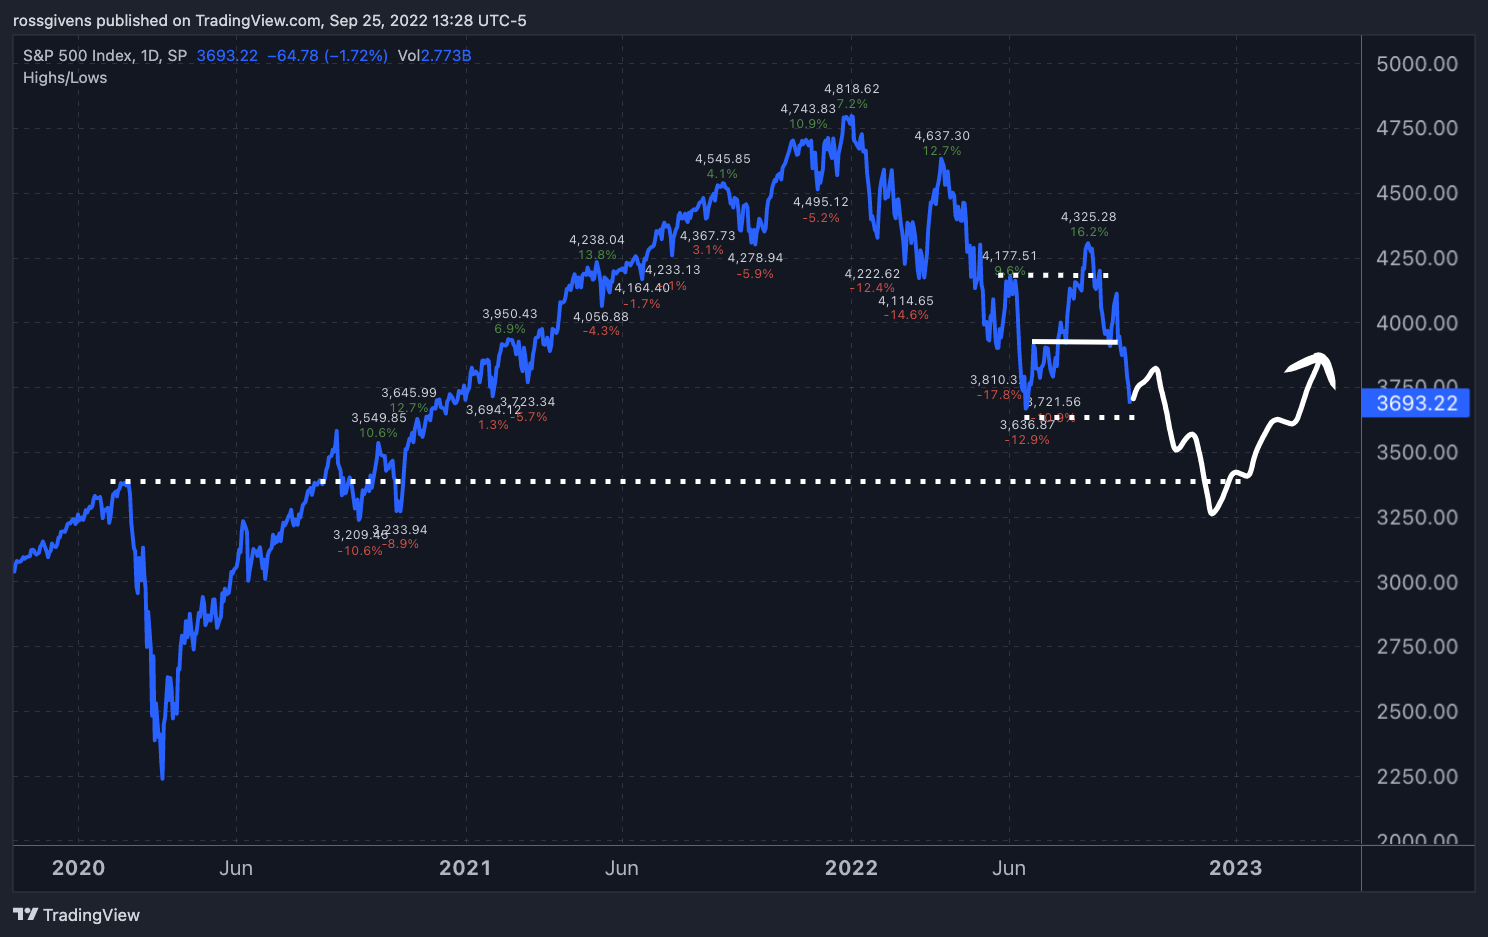
If we get a bounce here, I will be looking to sell short into the rally for a final leg lower to the 3,300 area on the S&P.
It may seem like ancient history at this point, but the pre-pandemic high for the market is at 3,393.52.
And I think a break of the June low could send the market there in a hurry.
Now, as I said above, we’ll have to go with the flow and react to the markets as they move…
But that area would be a logical place for the market to find support, assuming there are no more crazy economic or geopolitical developments.
Did You Miss The Premiere?
Did you miss the premiere presentation of my “rapid cash” strategy?
During the event, I explained my latest strategy for generating quick gains with weekly options.
This strategy is totally market neutral, so it doesn’t matter if a stock goes up or goes down. My system can set up these trades to win in either direction.
And since each trade is opened on a Monday and closed out by Friday, exposure to this wild market is limited…
If you want to learn exactly how this works, watch the on-demand replay session now.
Embrace the surge,

Ross Givens
Editor, Stock Surge Daily


