In late May, I gave you several key support and resistance levels for the S&P 500 index that I continue to have my eyes on.
At the time, the index was trading in a sideways consolidation channel around the 3,975 level.
And I explained that when that range was broken, there would be either a breakout or a breakdown.
Well, as it turns out, we actually saw both within the span of just a couple weeks…
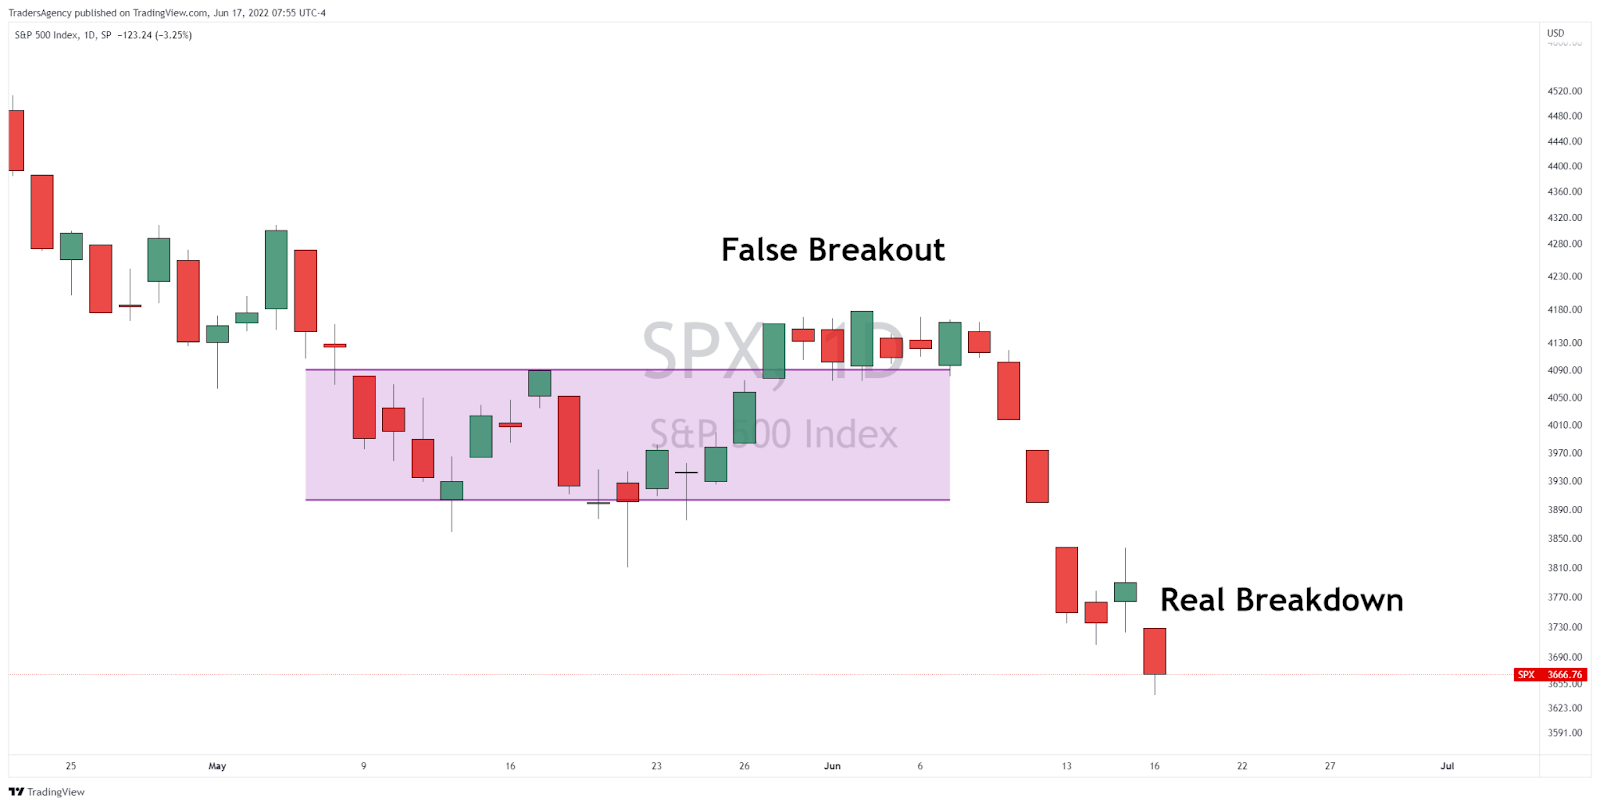
As you can see in the chart above, the S&P was able to break out above the top of the channel after a few big bullish days.
At first, this looked like a potential bottom for the market.
After all, the index closed above the top of the channel for eight trading days in a row and the economic news seemed to be getting somewhat better.
But as we now know, this turned out to be what traders call a “false breakout…”
Fake Break
Price immediately ran right into one of the resistance levels we had identified previously at 4,166.
Take another look at the same chart from above but with our previously identified support and resistance levels drawn…
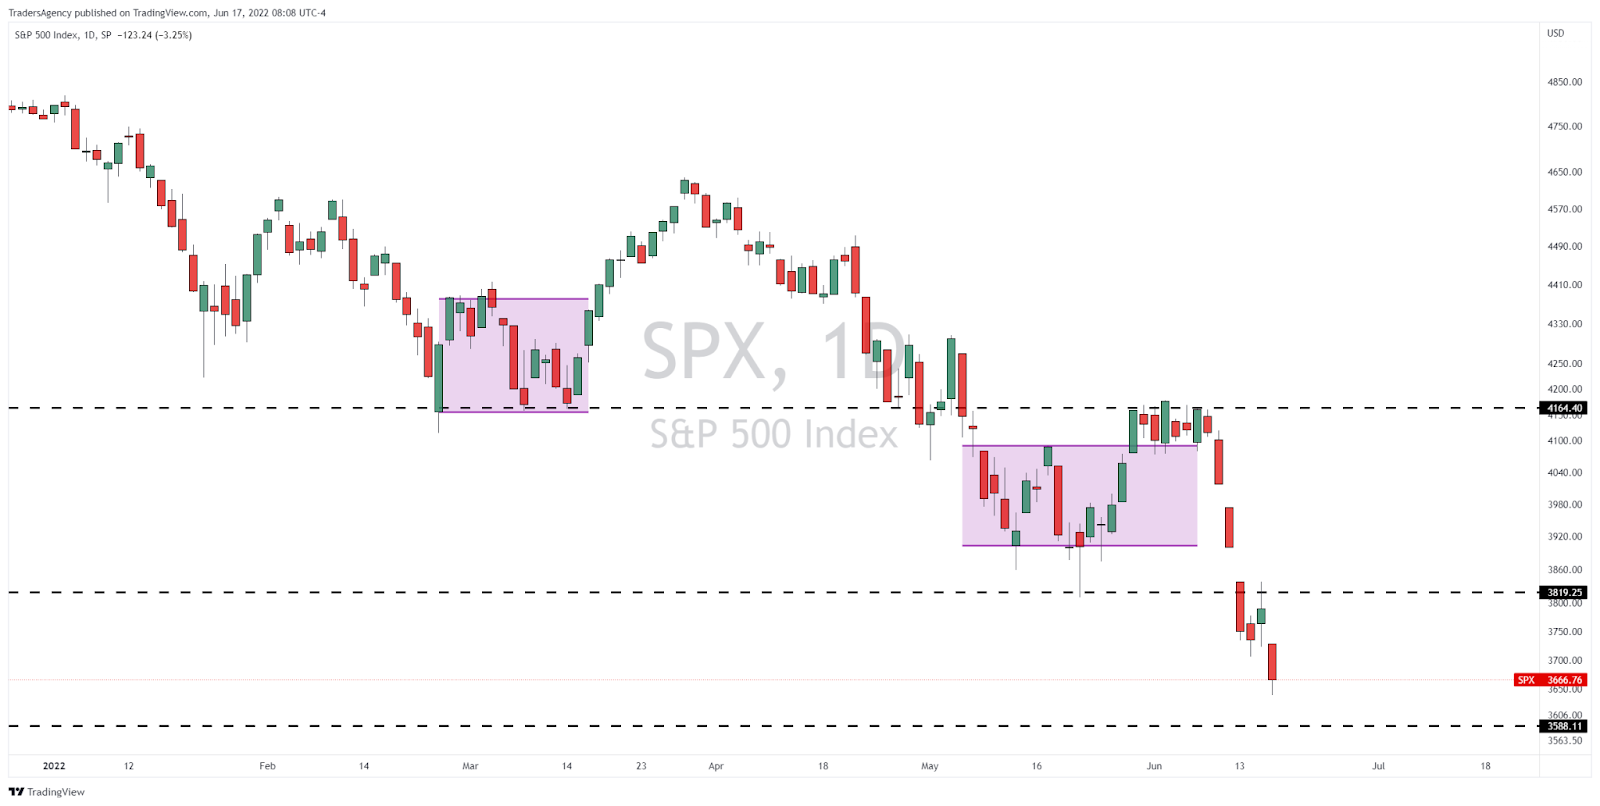
Notice how price bumped right up against that level but just couldn’t get through.
That should have been a sign that the market was not as strong as it looked based on what appeared to be a channel breakout.
Now, this false breakout turned into a real breakdown over the next couple of days, and the index sliced right through the next support level around 3,820.
And again, you can see that the index bounced right up into that level on Wednesday before getting rejected hard on Thursday.
It’s common knowledge among traders that when a past support level is broken, it often becomes future resistance. And when a past resistance level is broken, it often becomes future support.
So, while this particular support level didn’t really support the market at all, it should still have been on investors’ radars as a level to watch.
Looking Left
Next, let’s zoom out a bit and look left on the chart to see where the market could go from here…
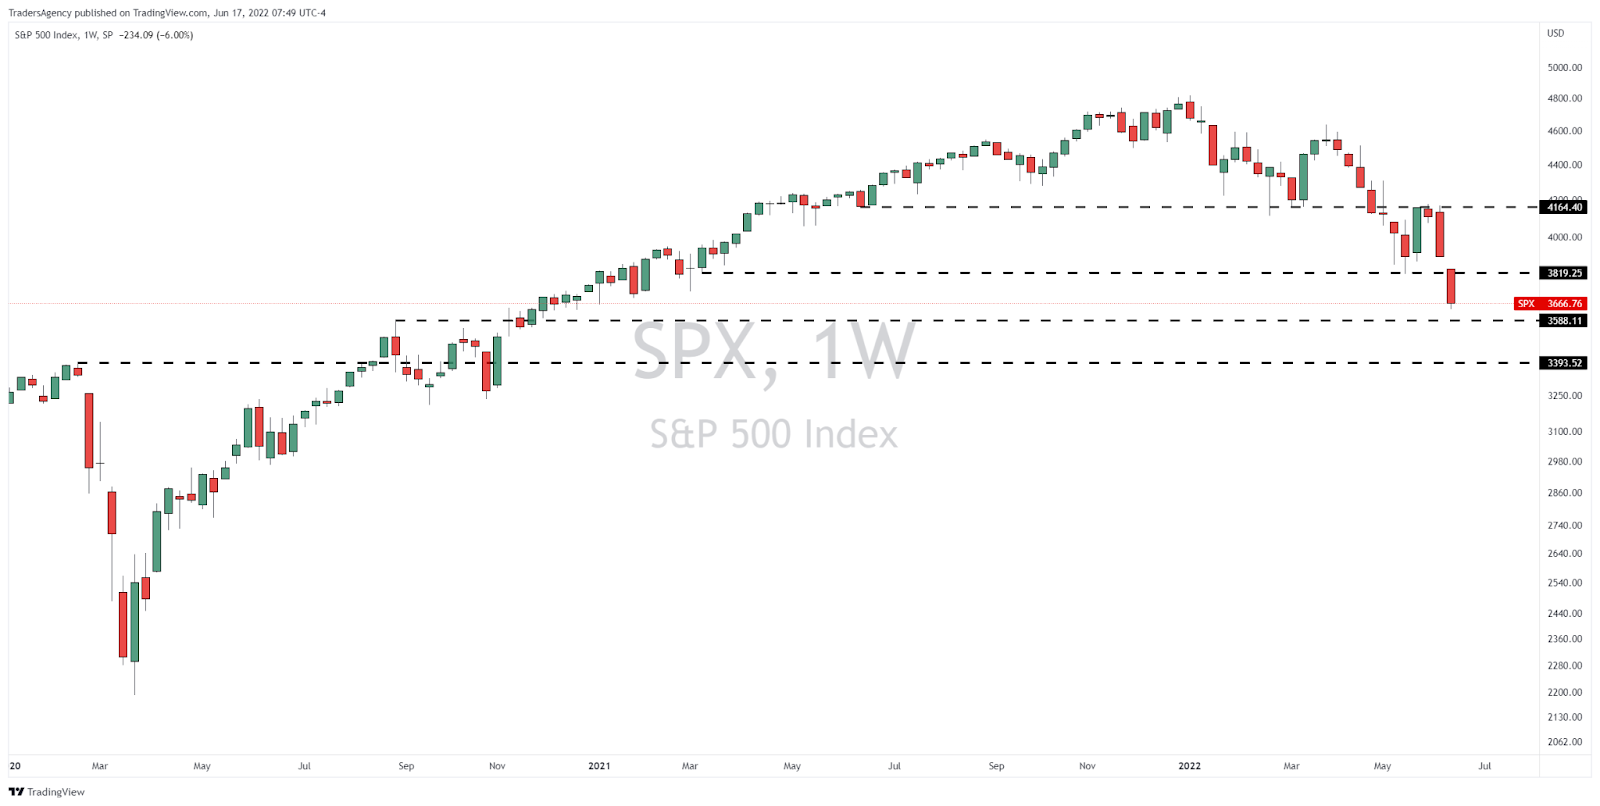
There are two more key levels to watch that could turn into potential support for the market.
First, there is another level of interest near 3,590, which is where the S&P topped out in September 2020 just before the big bullish move.
And second, a return to the pre-pandemic high at 3,393 is becoming more and more likely, in my opinion.
The index could be there in a matter of a few days at the current pace of selling…
Going Full Circle
Now, we’ll cross that bridge when we come to it, but the pre-pandemic high certainly seems like a logical place for the market to bottom out.
In fact, I’m already seeing a few individual stocks find support at their own pre-pandemic highs, and I think something similar could happen for the broader market.
Think about it… The Federal Reserve is currently in the process of reversing the zero-interest-rate policy it put in place in 2020 by raising rates aggressively.
And as rates get back to where they were before the pandemic, stocks should do the same.
I’ll have more to say on this next week along with some key stock examples, so stay tuned!
Follow Along
If you’ve been struggling in this wild stock market environment, with the major indexes down double-digits and many of last year’s leading stocks down over 50%…
Consider checking out my Alpha Stocks trading service, which focuses on only the very best stock trading opportunities — both on the long side as stocks rise and on the short side when markets are crashing.
We recently recorded a huge winning trade on the downside in only eight days as Pegasystems Inc. (PEGA) stock plunged…
As well as a gain of over 21% in just 15 days in Permian Basin Royalty Trust (PBT) as that stock broke out of its trading range.
And we get together every Monday for an hour-long live session so that subscribers can ask questions and get guidance about our trades.
If you’re ready to see what you could be missing out on, you’re in luck!
Embrace the surge,

Ross Givens
Editor, Stock Surge Daily


