The markets have been consolidating in a tightening range over the past two weeks, as you can see highlighted on the chart below.

This is very similar to what happened from mid-February to mid-March, which I’ve also highlighted on the chart.
The S&P traded in a range of roughly 6% for nearly a full month before breaking out to the upside and then rolling over to lower lows.
Now, there are really only three things that can happen with the current consolidation… Price can break out, break down or continue to consolidate.
I wouldn’t be surprised to see some further consolidation given all of the back-and-forth action we’ve seen lately.
But let’s cover the levels we should be watching so that when the markets do break down or break out higher, we will be ready.
Looking for Support
First off, I’ve identified six different levels of interest on the following weekly chart of the S&P 500…
Three potential support levels on the downside and three potential targets on the upside.
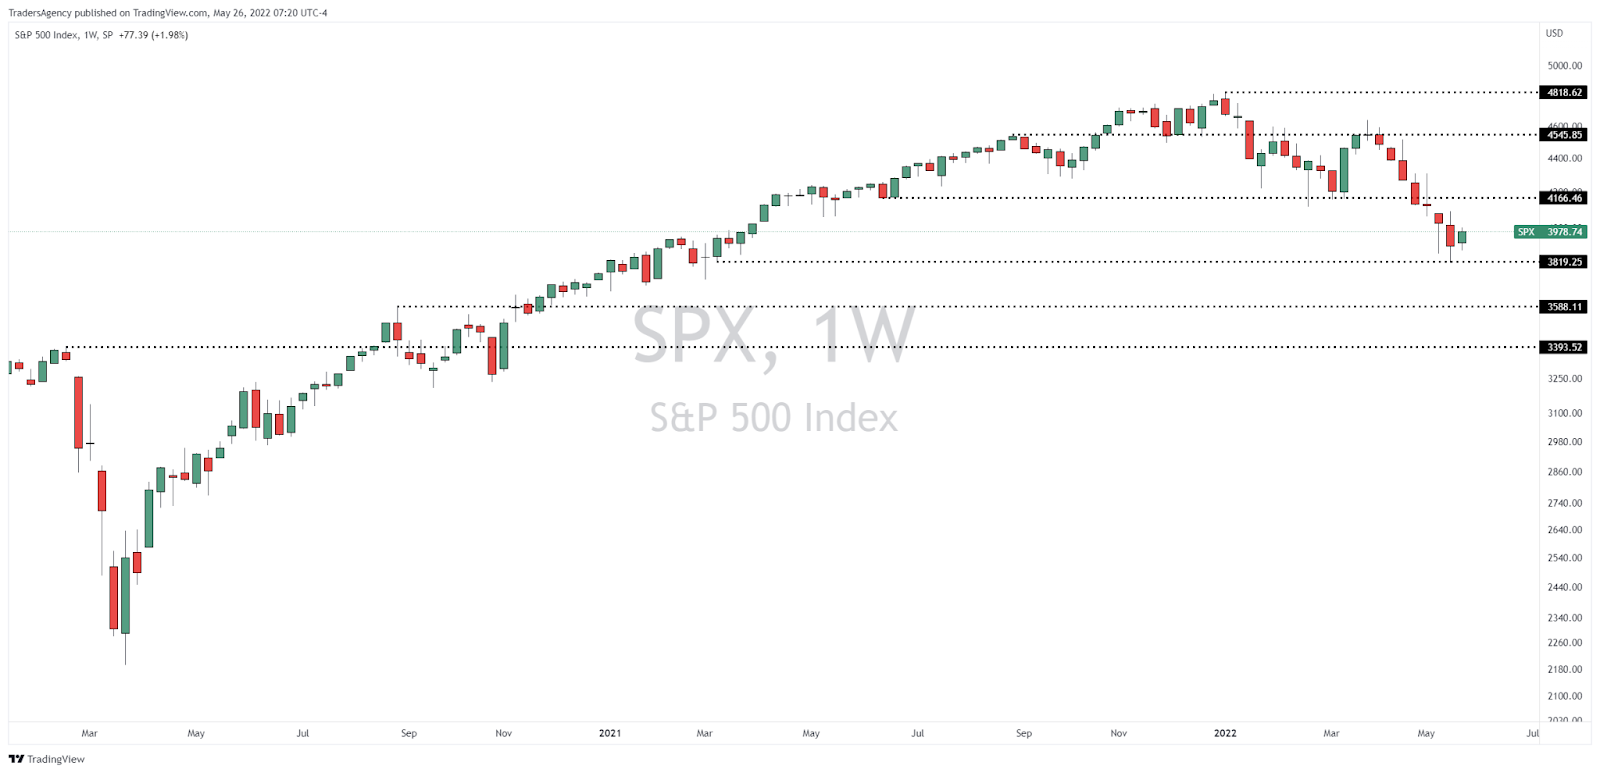
On the downside, the next level of potential support is just below current levels at approximately 3,820.
This level of interest was created by the consolidation that took place in January-March 2021, which the market tested and held above this level last Friday.
Below that, there is another level of interest near 3,590, about 10% below current levels.
This is the level where the S&P topped out in September 2020, which was the eventual launch point for the latest leg of the bull market.
Lastly, if the markets continue to show weakness, a test of the pre-pandemic highs at 3,393, about 15% below current levels, would not be out of the question.
That could potentially turn into a buyable low point, but we’ll cross that bridge when or if we come to it.
Look Out for Resistance
Now, while I do think this is a lower probability outcome, we’ll need to know where to look if the market breaks out to the upside.
Well, the first level I’d watch is where the market just broke down from earlier this month.
That level is approximately 4,166, which is about 5% above current prices.
This was the horizontal support level established by the first consolidation range noted above. After being broken to the downside, this level should now act as resistance.
If the market can manage to get through that level, the next level to watch is up at 4,545. This level marked the peak in September 2021 and the lows in December 2021.
Since then, this level has acted as resistance twice… First in early February 2022 and second in late March/early April.
In both of those periods, the S&P was trying to push back to the all-time highs. Unfortunately, both pushes turned into failed breakouts and sent the market lower again.
Lastly, the biggest potential resistance level is the all-time high at roughly 4,818, which at this point is about 21% above current levels.
If the S&P can get there, I think we’d all breathe a sigh of relief.
Prepare for the Worst, Hope for the Best
You’ve probably all heard the expression, “Prepare for the worst, hope for the best.”
This is basically my philosophy on the market right now. Of course, I’d like to see the market rally back to all-time highs and beyond.
However, until we see more than just a few select groups of stocks in the green (regular readers know that energy and shipping stocks are basically the only two groups making gains right now), most of the bulls out there are simply hoping for the best.
Given the weakness we’re seeing in the fundamental landscape as well as the deterioration in the market’s various sectors, I think the better plan is to prepare for the worst.
If we see another leg down, keep the levels we discussed above in mind.
They may not turn into buyable levels, but at least we’ll know where to expect a bounce that we can then short into.
Stay tuned!
Ready for the Big Debut?
Before I go, I need to invite you to a LIVE special event happening on TODAY, May 26th at 1 PM…
My colleague and expert trader Josh Martinez is set to unveil his brand-new professional-grade system that virtually anyone can use with minimal upfront investments…
We’re talking as low as FIFTY BUCKS! You don’t want to miss this!
Click here to snag your seat for the main event happening TODAY, May 26th at 1PM.
Embrace the surge,

Ross Givens
Editor, Stock Surge Daily


