Last week, we talked about the “double bottom” pattern and explained why we could be seeing one form in the S&P 500.
With yesterday’s big gain in the broad market and with another big push by the bulls ahead of the open this morning, we’re hoping that the June lows continue to hold and that the double bottom is almost complete.
But while we wait for that pattern to hopefully resolve itself to the upside, let’s cover its bearish counterpart… The “double top” pattern.
What To Look For
Just like the double bottom, the double top is a trend reversal pattern.
The big difference, of course, is that a double bottom forms at the end of a down trend, while a double top forms at the end of an up trend.
So, instead of looking for a “W-shaped” pattern on the chart, you want to look for an “M-shaped” pattern with two clearly defined peaks.
For example, take a look at the weekly chart of the SPDR Gold Shares (GLD), which is an exchange-traded fund (ETF) that aims to track the price of gold.
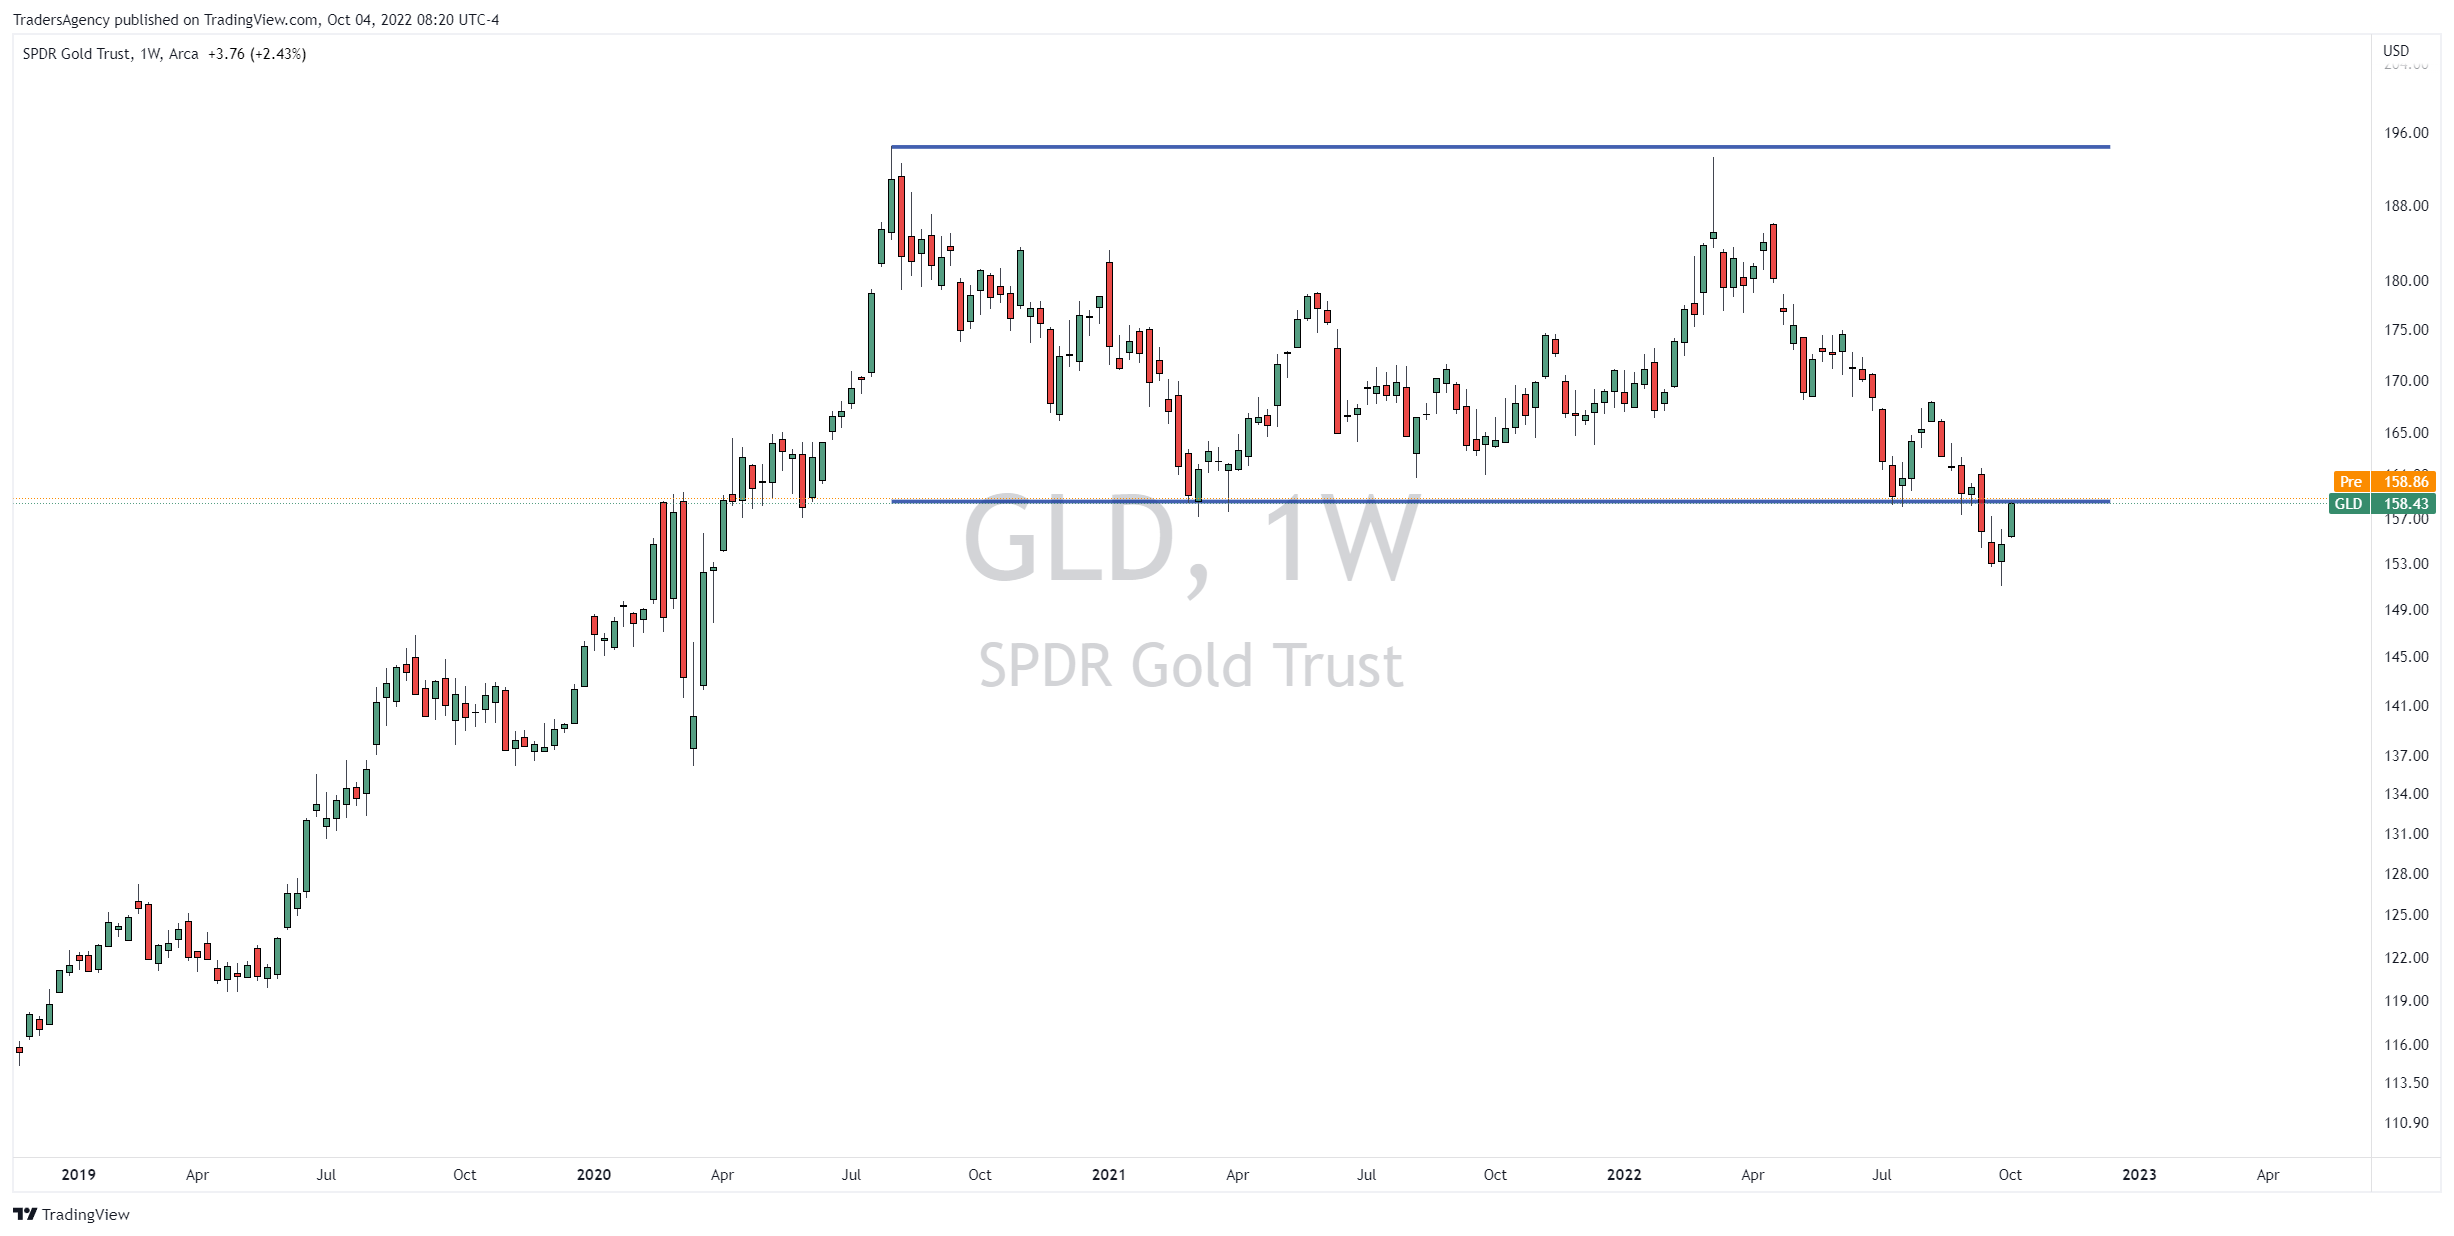
In the chart above, you can see that a double top formed in GLD between August 2020 and March 2022.
You will also notice that I’ve drawn a resistance line from the top of the first peak and a support line from the bottom of the initial drop.
The double top begins to form when the price touches overhead resistance twice. However, it is only confirmed once the price breaks below support.
Wait for Confirmation
As you can see in this example, it took quite a while for price to move back to support and even longer to break below it.
But finally, this double top in GLD was confirmed when price broke down through support in early September.
Now, this pattern could be used in a couple of ways…
First, a bullish trader who had a position in GLD could use a break of the support level as the stop for a long position.
More likely, though, would be for a bearish trader to use the break of support as an entry signal for a short position.
Projecting the Pattern
Now, this is just an example…
But if we were looking for a short idea, we could project the estimated price target based on the height of the pattern…
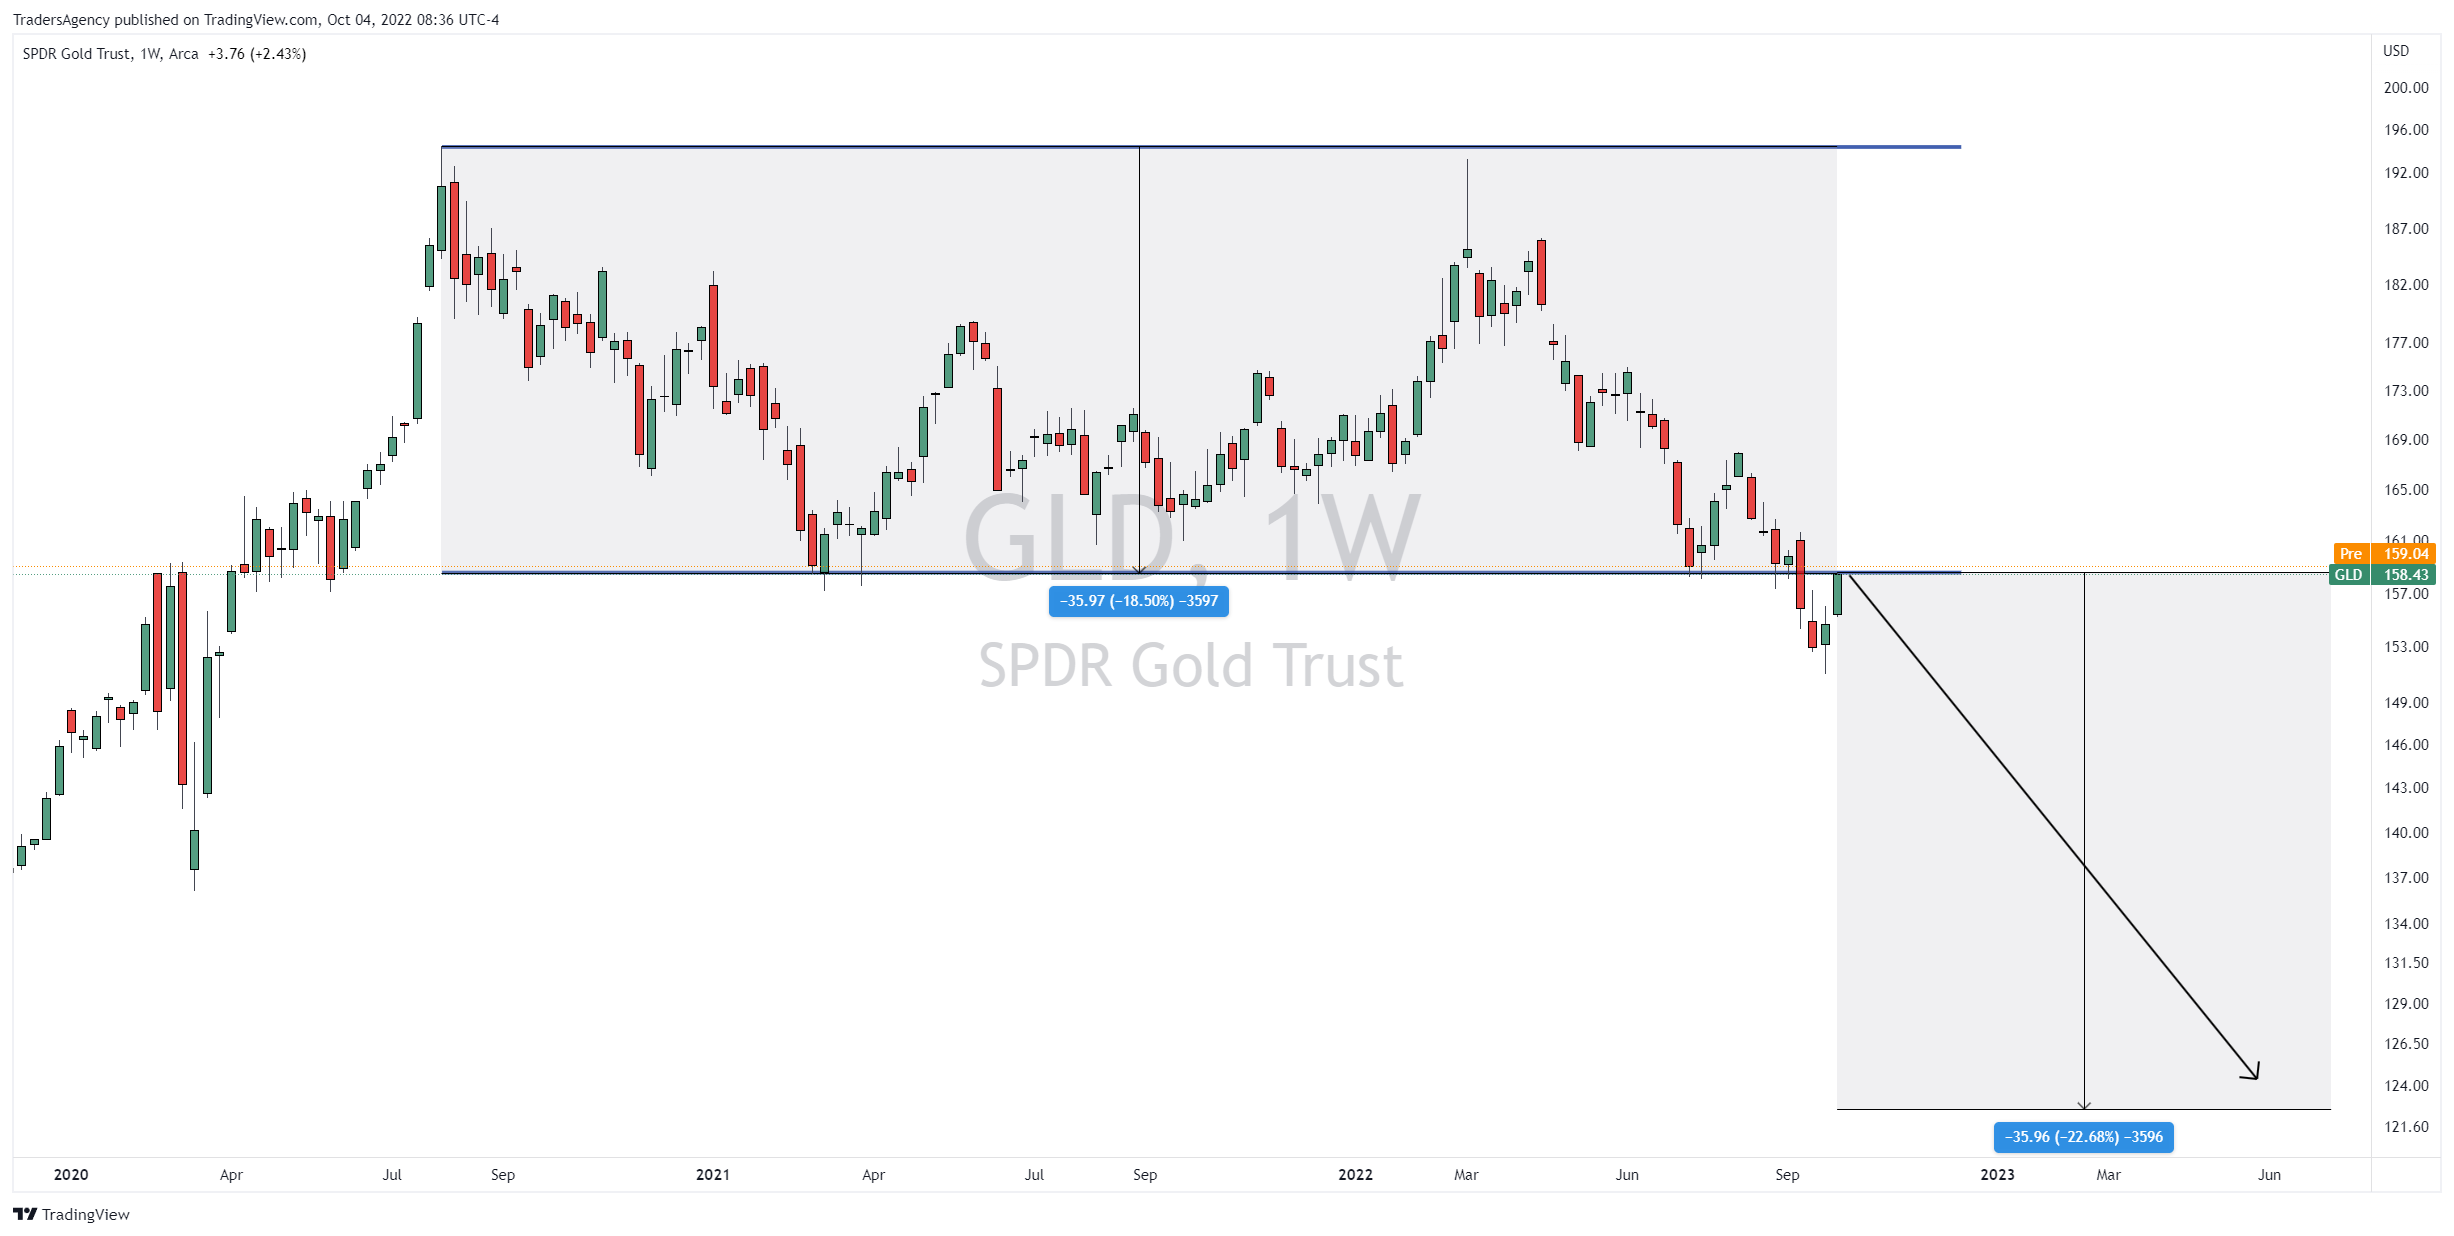
In this example, the height of the pattern is about $36 from top to bottom.
We can then subtract that $36 from the price of the support level, which is about $158.
That gives us a potential price target of about $122 per share, or a further drop of almost 23%.
Again, this is not a recommendation to sell or short GLD…
But I wanted to show you how to do this projection so you are able to use it in your own trading if and when the situation arises.
Join Me Today at Noon!
Did you miss the premiere presentation of my “rapid cash” strategy?
During the event, I explained my latest strategy for generating quick gains with weekly options.
This strategy is totally market neutral, so it doesn’t matter if a stock goes up or goes down…
My system can set up these trades to win in either direction.
And since each trade is opened on a Monday and closed out by Friday, exposure to this wild market is limited…
Embrace the surge,

Ross Givens
Editor, Stock Surge Daily


