Micron Technology, Inc.
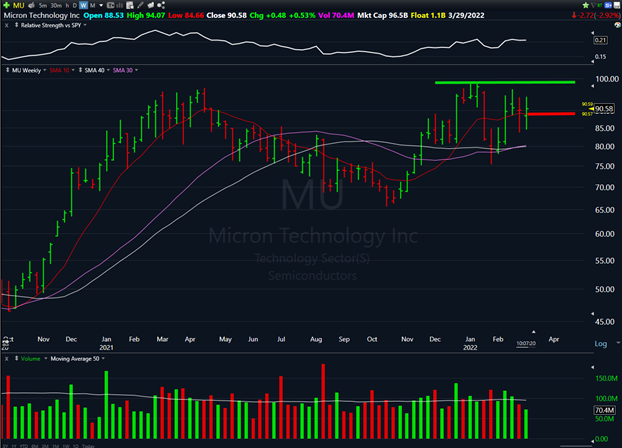
Micron Technology, Inc. (MU) is the $93 billion semiconductor manufacturer that makes memory and other storage devices for a wide range of applications.
The shares were on the decline for most of last year but have recovered and started to push the prior highs again.
Here’s how the chart is setting up…
And here’s how the stock is setting up with my Stock Surge Indicator:
- Surge score: 87/100
- % Above 52-wk low: 38%
- Sales growth: +33%
- Triple momentum: yes
This is a longer-term setup that could deliver longer-term gains in the form of a larger, multi-month move.
The chart above is using weekly bars to show more historical data.
MU began forming a “cup and handle” base pattern in January 2021 that is now working to complete itself.
If the stock breaks out to new high ground, consider buying MU shares with a stop at the 50-day simple moving average, currently near the $90 mark.
Cenovus Energy Inc.
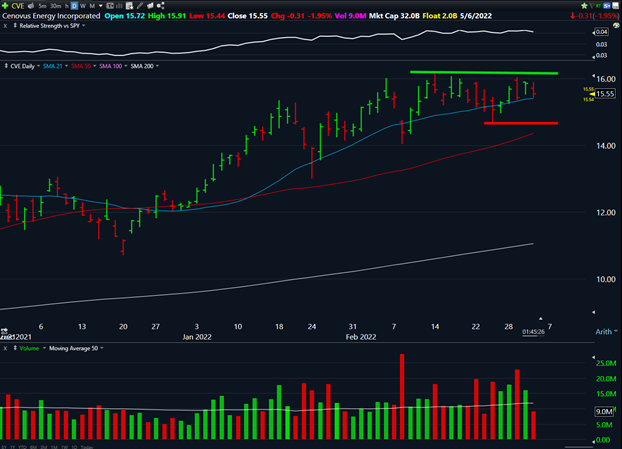
Cenovus Energy Inc. (CVE) is a $31 billion oil and gas producer based out of Calgary, Canada.
The shares have been on the ascent since the start of the year and look primed for a possible breakout.
Here’s how the chart is setting up…
And here’s how the stock is setting up with my SSI:
- Surge score: 87/100
- % Above 52-wk low: 116%
- Sales growth: +287%
- Triple momentum: yes
With crude prices topping $115 per barrel, it is no surprise that a lot of energy names are still showing up as the top performers on my scans.
CVE is compressing nicely from left to right in a verified Stage 2 uptrend.
Look for a strong move through the $16 area to buy.
Then, place a sell stop beneath the swing low at $14.60 for protection.
Northern Oil and Gas, Inc.
Northern Oil and Gas, Inc. (NOG) is another oil and gas producer with a much smaller market cap of just around $2.1 billion.
Shares have been rising strongly since November 2020 but are just getting back to the highs of last year.
Here’s how the chart is setting up…

And here’s how the stock is setting up with my SSI:
- Surge score: 98/100
- % Above 52-wk low: 126%
- Sales growth: +537%
- Triple momentum: no
I’ve chosen to show the weekly chart for NOG above as well.
The stock is completing a five-month base pattern and trying to breakout to the upside.
Shares broke out last week before pulling back slightly.
At the time of this writing, NOG is trading at $26.50 – right near the breakout point.
As long as price does not get extended by Monday morning, I think this can be bought here with a stop at $23.30.
Before I go, you’d like a step-by-step walkthrough on how to best take advantage of trades like these…
Be sure to check out my recent article, How to Follow My Weekly Trades, to know where I’m buying so that you can follow along.


