Some investors call it a “consolidation area.” Others call it a “trading range.”
But William O’Neil, investment pioneer and founder of Investor’s Business Daily, called it a “base.”
You’ll probably hear me use that term more often than not, but these terms are largely interchangeable.
Whatever you call it, these terms all refer to a particular technical pattern…
The pattern is characterized by a relatively tight trading range where a stock catches its breath after a large move up or down.
Very little happens inside the base.
And unless you’re trying to scalp the edges, there isn’t much opportunity for profit.
The real money is made when stocks finally move out of a base.
And, generally speaking, the bigger the base… the better the breakout.
Why Bigger Bases are Better
Like most things in life, bases come in all sorts of shapes and sizes.
Short-term bases can form over a few weeks or months, while long-term bases can span years or even decades.
Take a look at the chart of National Storage Affiliates Trust (NSA) below for an example…
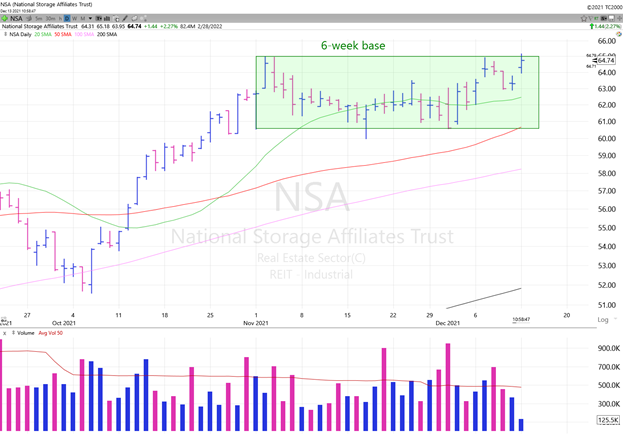
The stock tried to come out of a short, six-week base on Monday.
The pattern is technically sound, and stocks break out from formations like this quite often.
But if I have to choose between a stock like this with a short-term base or a stock making a bigger, longer-term base, I will always choose the stock with the larger base.
Why?
Because larger base patterns have a higher probability of success.
There is also a greater chance of an extended move.
In other words, big bases tend to lead to big breakouts.
For an example of a longer-term base, check out this chart of Amphastar Pharmaceuticals, Inc. (AMPH).

AMPH is on the verge of breaking out from a 68-week base.
That’s why I added it to the Stock Surge Daily Watchlist on Monday.
Nothing is guaranteed, of course.
But a year and a half is a long time to trade in a 20% range.
Once shares find their way to new highs, things could get interesting fast.
I’ll be updating you on this name as the situation progresses, so stay tuned.
And if you’d like a step-by-step walkthrough on how to best take advantage of these weekly trades…
Be sure to check out my recent article, How to Follow My Weekly Trades, to know where I’m buying so that you can follow along.
Embrace the surge,

Ross Givens
Editor, Stock Surge Daily


