Hey, Ross here:
Markets are off to another good start coming out of the long weekend…
Even though the situation in Iran appears to have flared up again.
That can seem pretty contradictory…
Which is why, as today’s chart shows – lots of people are betting on the market falling.
Chart of the Day
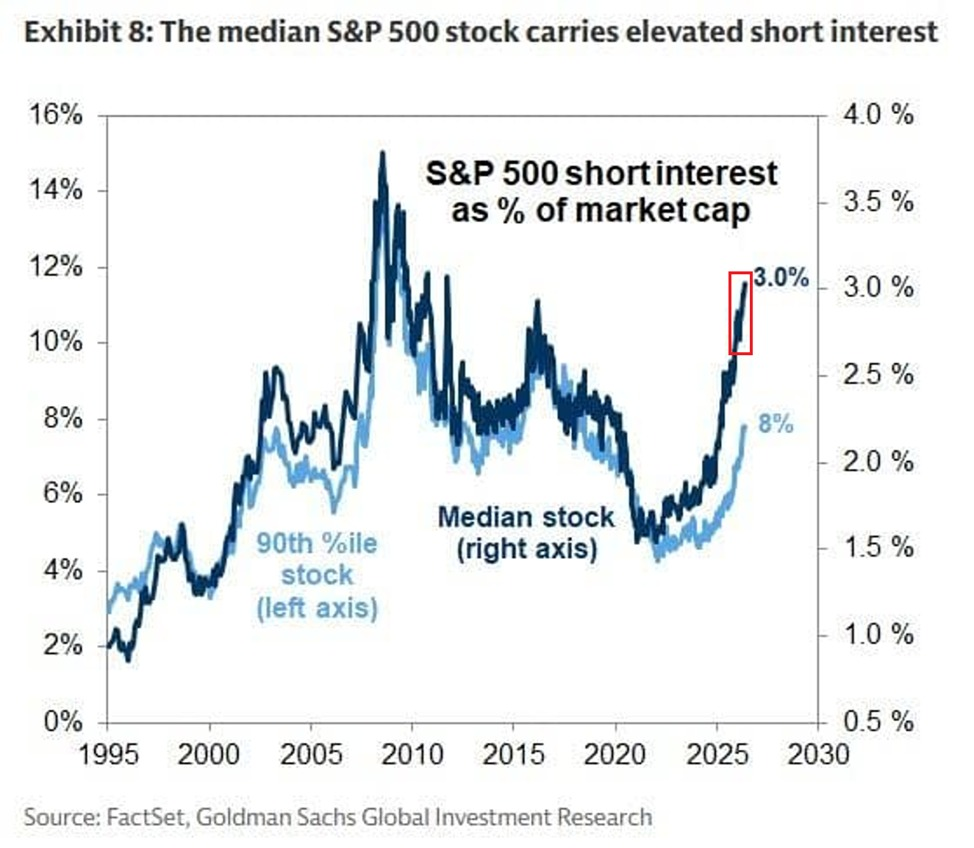
Take a look at this chart.
It shows short interest across the S&P 500.
Short interest measures how much investors are betting against a stock.
And right now, the median S&P 500 stock (dark blue line) now has short interest around 3% of market cap – the highest level since 2012.
Meanwhile, the most heavily shorted stocks (lighter blue line) are also seeing short interest climb sharply.
So despite the market holding up well…
Despite stocks starting the week strong…
And despite buyers continuing to show up…
A lot of traders are still betting against this rally.
But as I explain below…
This may actually give us MORE reason – not less – to keep participating in the rally.
Insight of the Day
High short interest can counterintuitively become fuel for the market.
Because every short position eventually has to be bought back.
So if stocks keep rising, those bearish traders may be forced to cover their shorts…
Which means buying the very stocks they were betting against.
That can push prices even higher.
And when you look at the historical data on how the S&P 500 has performed following powerful 8-week rallies like the one we’ve just seen…
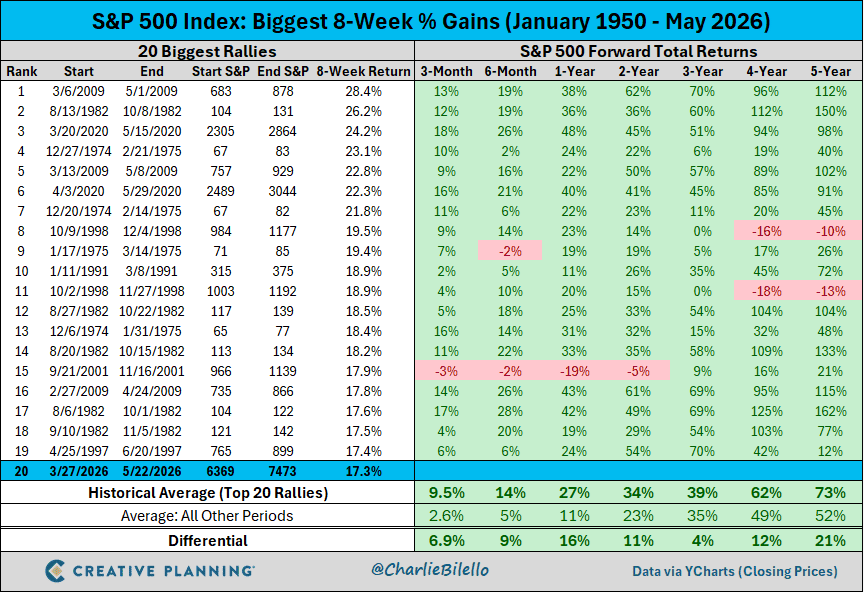
The forward returns are overwhelmingly positive.
And that means the odds are that this short interest will actually become further fuel for the rally…
Which is exactly what we want to see.
Of course, just like with anything in this dispersed market – the gains will not be distributed evenly.
That’s why later this afternoon at 3 p.m. Eastern…
I’m going LIVE to walk you through my #1 performing chart pattern of all time.
This pattern has been used by the world’s greatest traders for decades to reap explosive profits in almost any kind of market.
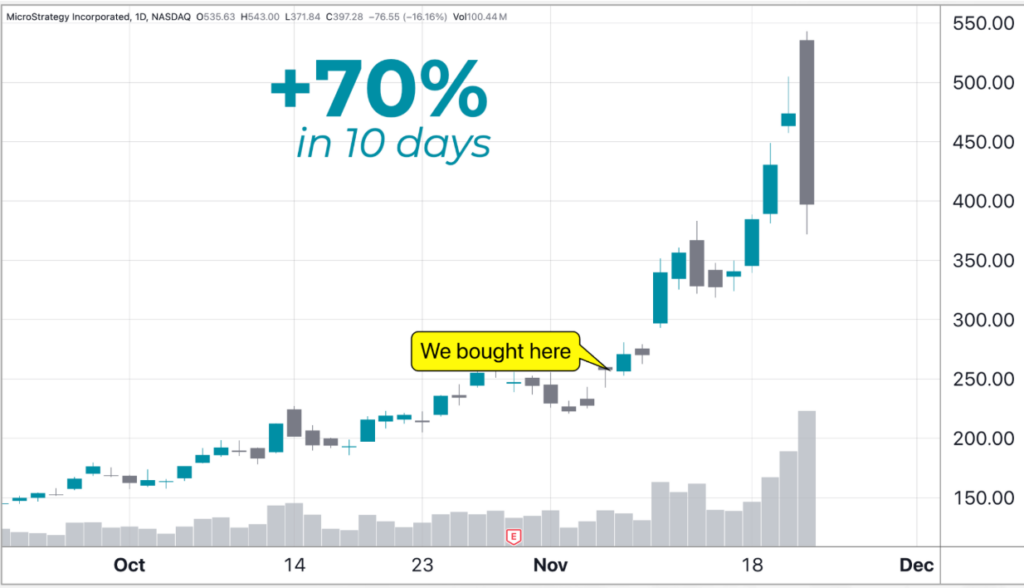
And it has helped our members get the shot at gains like 70% in 10 days…
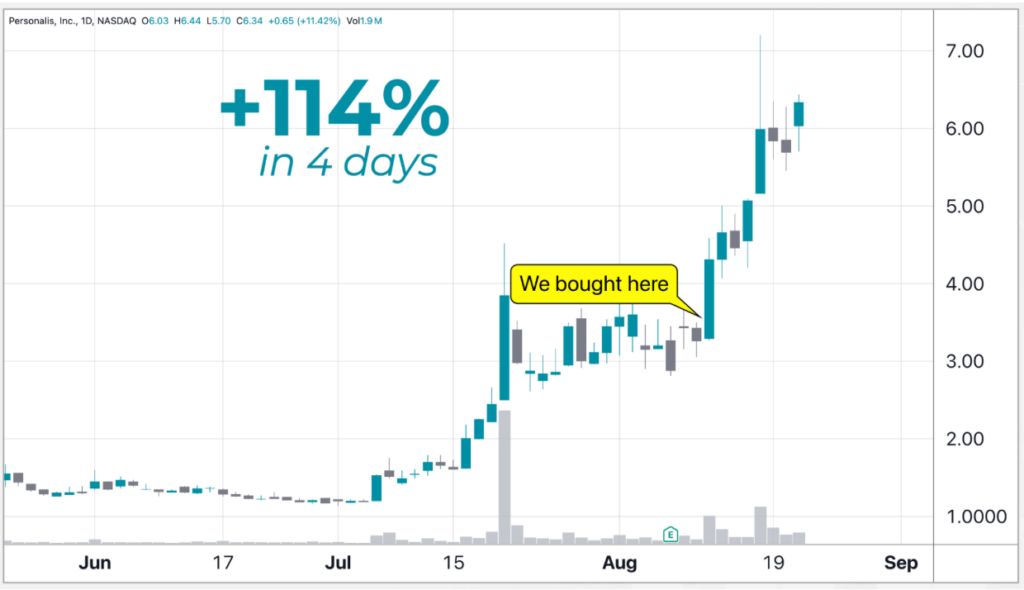
114% in 4 days…
And even 148% in just 2 days:
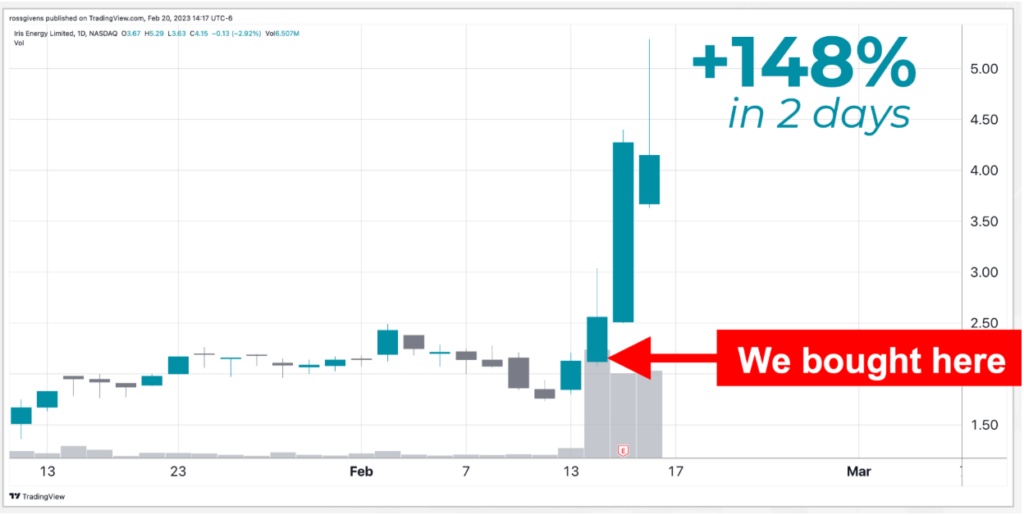
I’ll be sharing all the details of this prophetic pattern later this afternoon…
Including the name and ticker of a stock that’s setting up for a potentially massive move right now.
It’s free to attend, but seating is limited and we expect a packed house…
So click here to guarantee your seat if you haven’t already…
And I’ll see you later this afternoon at 3 p.m. ET.
P.S. If you’re planning to attend on a mobile device, make sure you download the presentation app now so you don’t miss anything when it starts. See you there.
iOS: https://apps.apple.com/us/app/goto/id1465614785
Android: https://play.google.com/store/search?q=goto&c=apps
Customer Story of the Day
“Ross Givens from Trader’s Agency is an awesome resource to help you with your investing needs and investing education.
I waited about three months to write this review to give myself time to see the impact on my portfolio and I have been completely satisfied.
Ross has a no nonsense, simple approach that makes it easy for all investors and he takes the time to answer all questions on a weekly basis.
Thanks, Ross and Traders Agency!”

Ross Givens
Editor, Stock Surge Daily