Editor’s Note: All major U.S. stock markets are closed today, May 30, in observance of Memorial Day.
Stocks finally began to reverse course last week, posting their first positive week in two months.
The market is attempting to put in a bottom, and we got our first official follow-through day on Thursday.
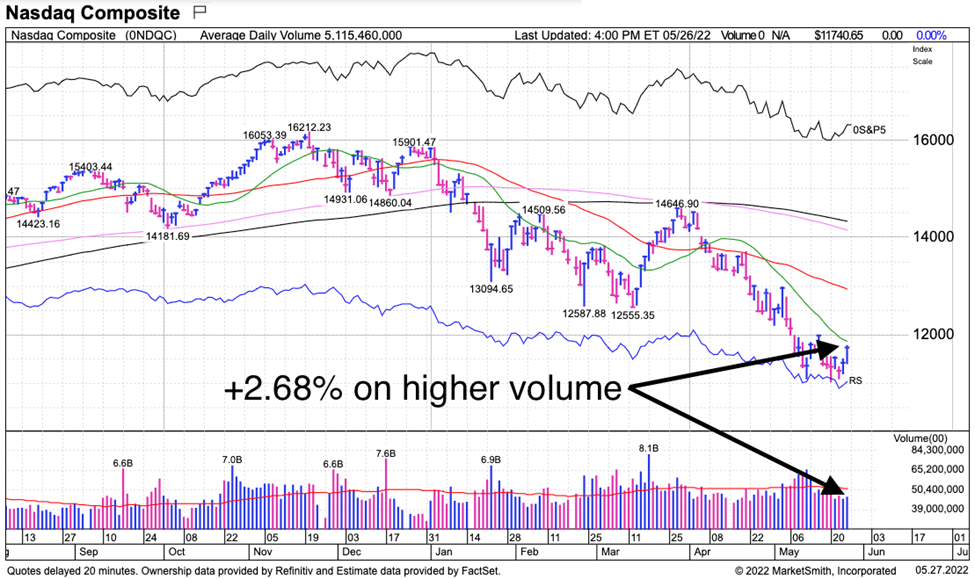
The Nasdaq Composite index was up 2.68% on increased volume from the previous day.
However, the rally still occurred on below-average volume.
So, even though it meets the textbook definition of a follow-through day, I am waiting to get aggressive until I see additional confirmation.
What I want to see is signs of institutional accumulation.
Specifically, I want to see several days of higher highs and higher lows on above-average trading volume.
When I see that, I will begin increasing my exposure.
Additionally, data are beginning to show that we may have hit peak inflation.
The market actually rose on news that the Fed would continue to aggressively raise rates.
Wall Street is viewing this as a positive and has likely already priced in all other negative news.
Combined, these are good signs that we could be near the end of the bear market.
In the intermediate term, I am watching the 4,300 level on the S&P 500.
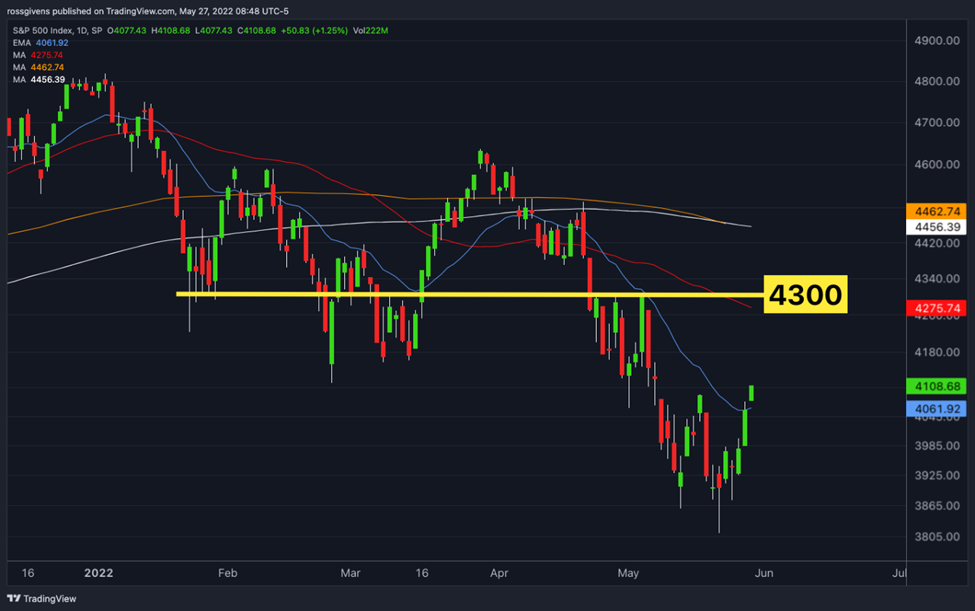
This served as support in January and then resistance in the April rally attempt.
A strong move above this level would get the index above its 50-day moving average and signal a real chance for a sustained rally to the upside.
With all that in mind, our Watchlist is back to bullish trades this week. Here are three ideas I expect to perform well during this rebound…
Aris Water Solutions, Inc.
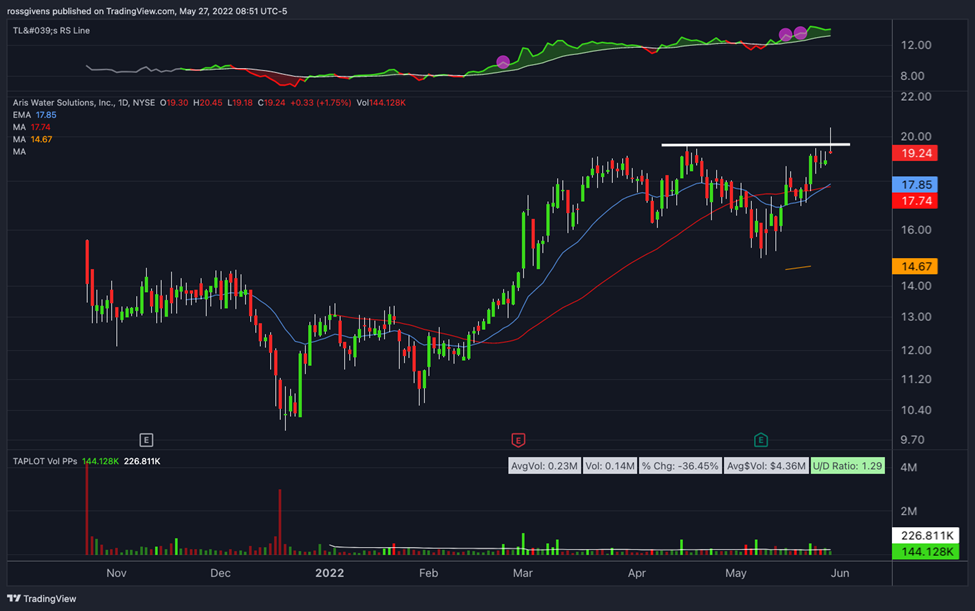
Aris Water Solutions, Inc. (ARIS) is a recent initial public offering (IPO) currently forming its first base.
The company operates as a regulated water utility company and has a market value of $1.7 billion at current levels.
- Surge score: 96/100
- % Above 52-wk low: 94%
- Sales growth: +54%
- Return on Equity: N/A
- Triple momentum: yes
Price came strong off the lows, rallying 94% during what has been a vicious bear market this year.
This is a real sign of strength, and the stock could take off if the market rallies from here.
Shares formed a “cup with handle” pattern over the last several weeks, and I am looking for a strong move above $19.50 on decent volume.
Consider placing a stop at $18.25 for a low-risk trade.
United States Oil Fund, LP
The United States Oil Fund, LP (USO) is a $2.9 billion exchange-traded fund (ETF) that tracks the price of crude oil. It trades like a regular stock.
- Surge score: 98/100
- % Above 52-wk low: 95%
- Sales growth: N/A
- Return on Equity: N/A
- Triple momentum: yes
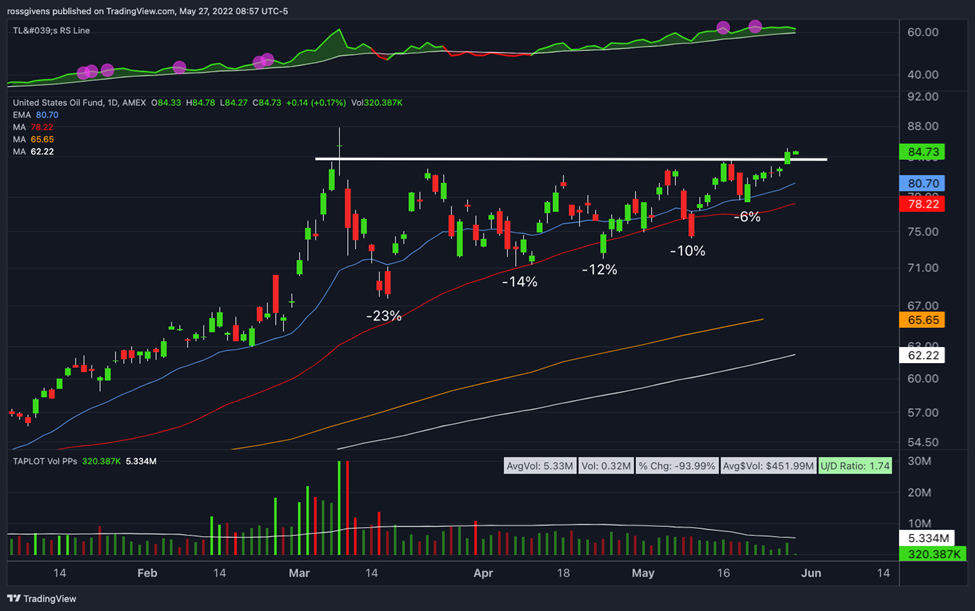
Oil had a big surge at the beginning of the year, but price got ahead of itself.
It has since consolidated in an orderly fashion with pullbacks shallowing from 23% down to 6%.
It is now breaking above the $83 resistance area and attempting to make a run.
Volume declined greatly in the weeks leading up to the breakout, which is generally a sign of decreasing supply and a lack of sellers… both good things for bulls.
I want to see a strong move higher on a spike in daily trading volume.
Set a stop loss about 7% below the entry for protection.
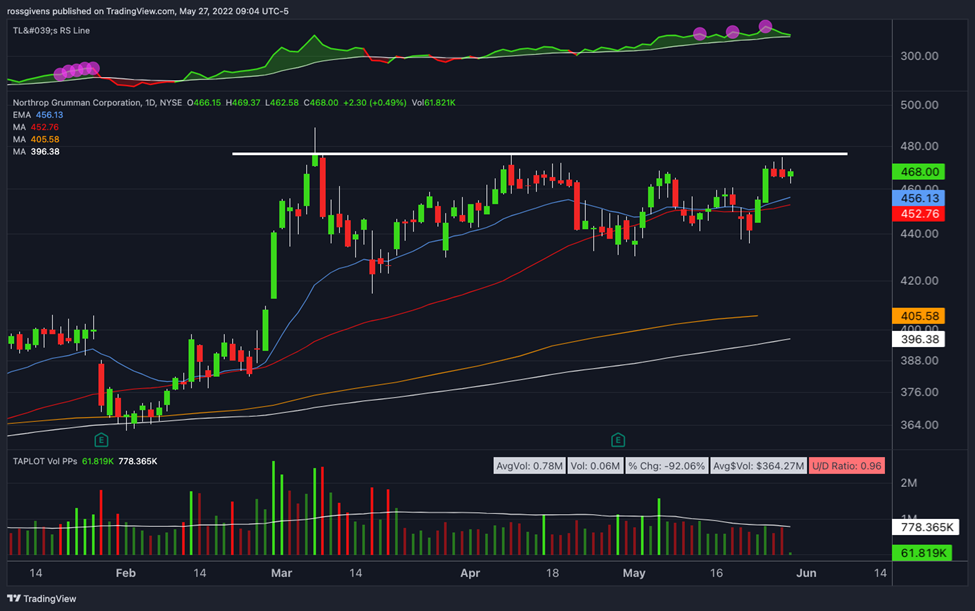
Northrop Grumman Corporation
Northrop Grumman Corporation (NOC) is a $72.6 billion aerospace and defense company.
It’s been a top-performing stock this year. Shares are up 22% year-to-date, while most stocks are down significantly.
- Surge score: 95/100
- % Above 52-wk low: 37%
- Sales growth: -4%
- Return on Equity: 32%
- Triple momentum: yes (short)
After a big move higher in late February, NOC has consolidated and formed a tight base pattern.
Volume is drying up, price action is tight, moving averages are pointing higher and relative strength scores 95/100.
All factors point to a potential breakout in this stock.
I will consider buying if NOC trades above $476. As always, I want to see a breakout on above-average volume.
Once triggered, my stop loss would be at $441 for a 7% risk on the trade.
Join the Stealth Team
Before you go, I invite you to join me at Stealth Trades for a very special price of $0.99 for a full year…
Institutional investors like pension funds, mutual funds, hedge funds and other large players make massive institutional buys that fly under the radar of most individual investors.
But if you know how to spot those buys in real time, you can potentially follow the big money to big gains.
This is what I focus on inside my premium Stealth Trades research service.
To learn more about the service and how you can get involved for just $0.99, click here now.
Embrace the surge,

Ross Givens
Editor, Stock Surge Daily


