Regular readers know that I’m not a BTC believer… At least, not yet.
First off, BTC is way too easy to lose. I don’t want my money stashed away on some hard drive that could get stolen or thrown out with the trash.
Second, BTC is not the safe haven investment it was advertised as. If you need proof, just look at the price chart during the past year of market turmoil.
But really, that’s what it all comes down to for me… Price.
And unfortunately for the BTC fanatics out there, I’m seeing three big signs that I believe will lead BTC to lower prices in the coming weeks…
Pressure from a Strong Dollar
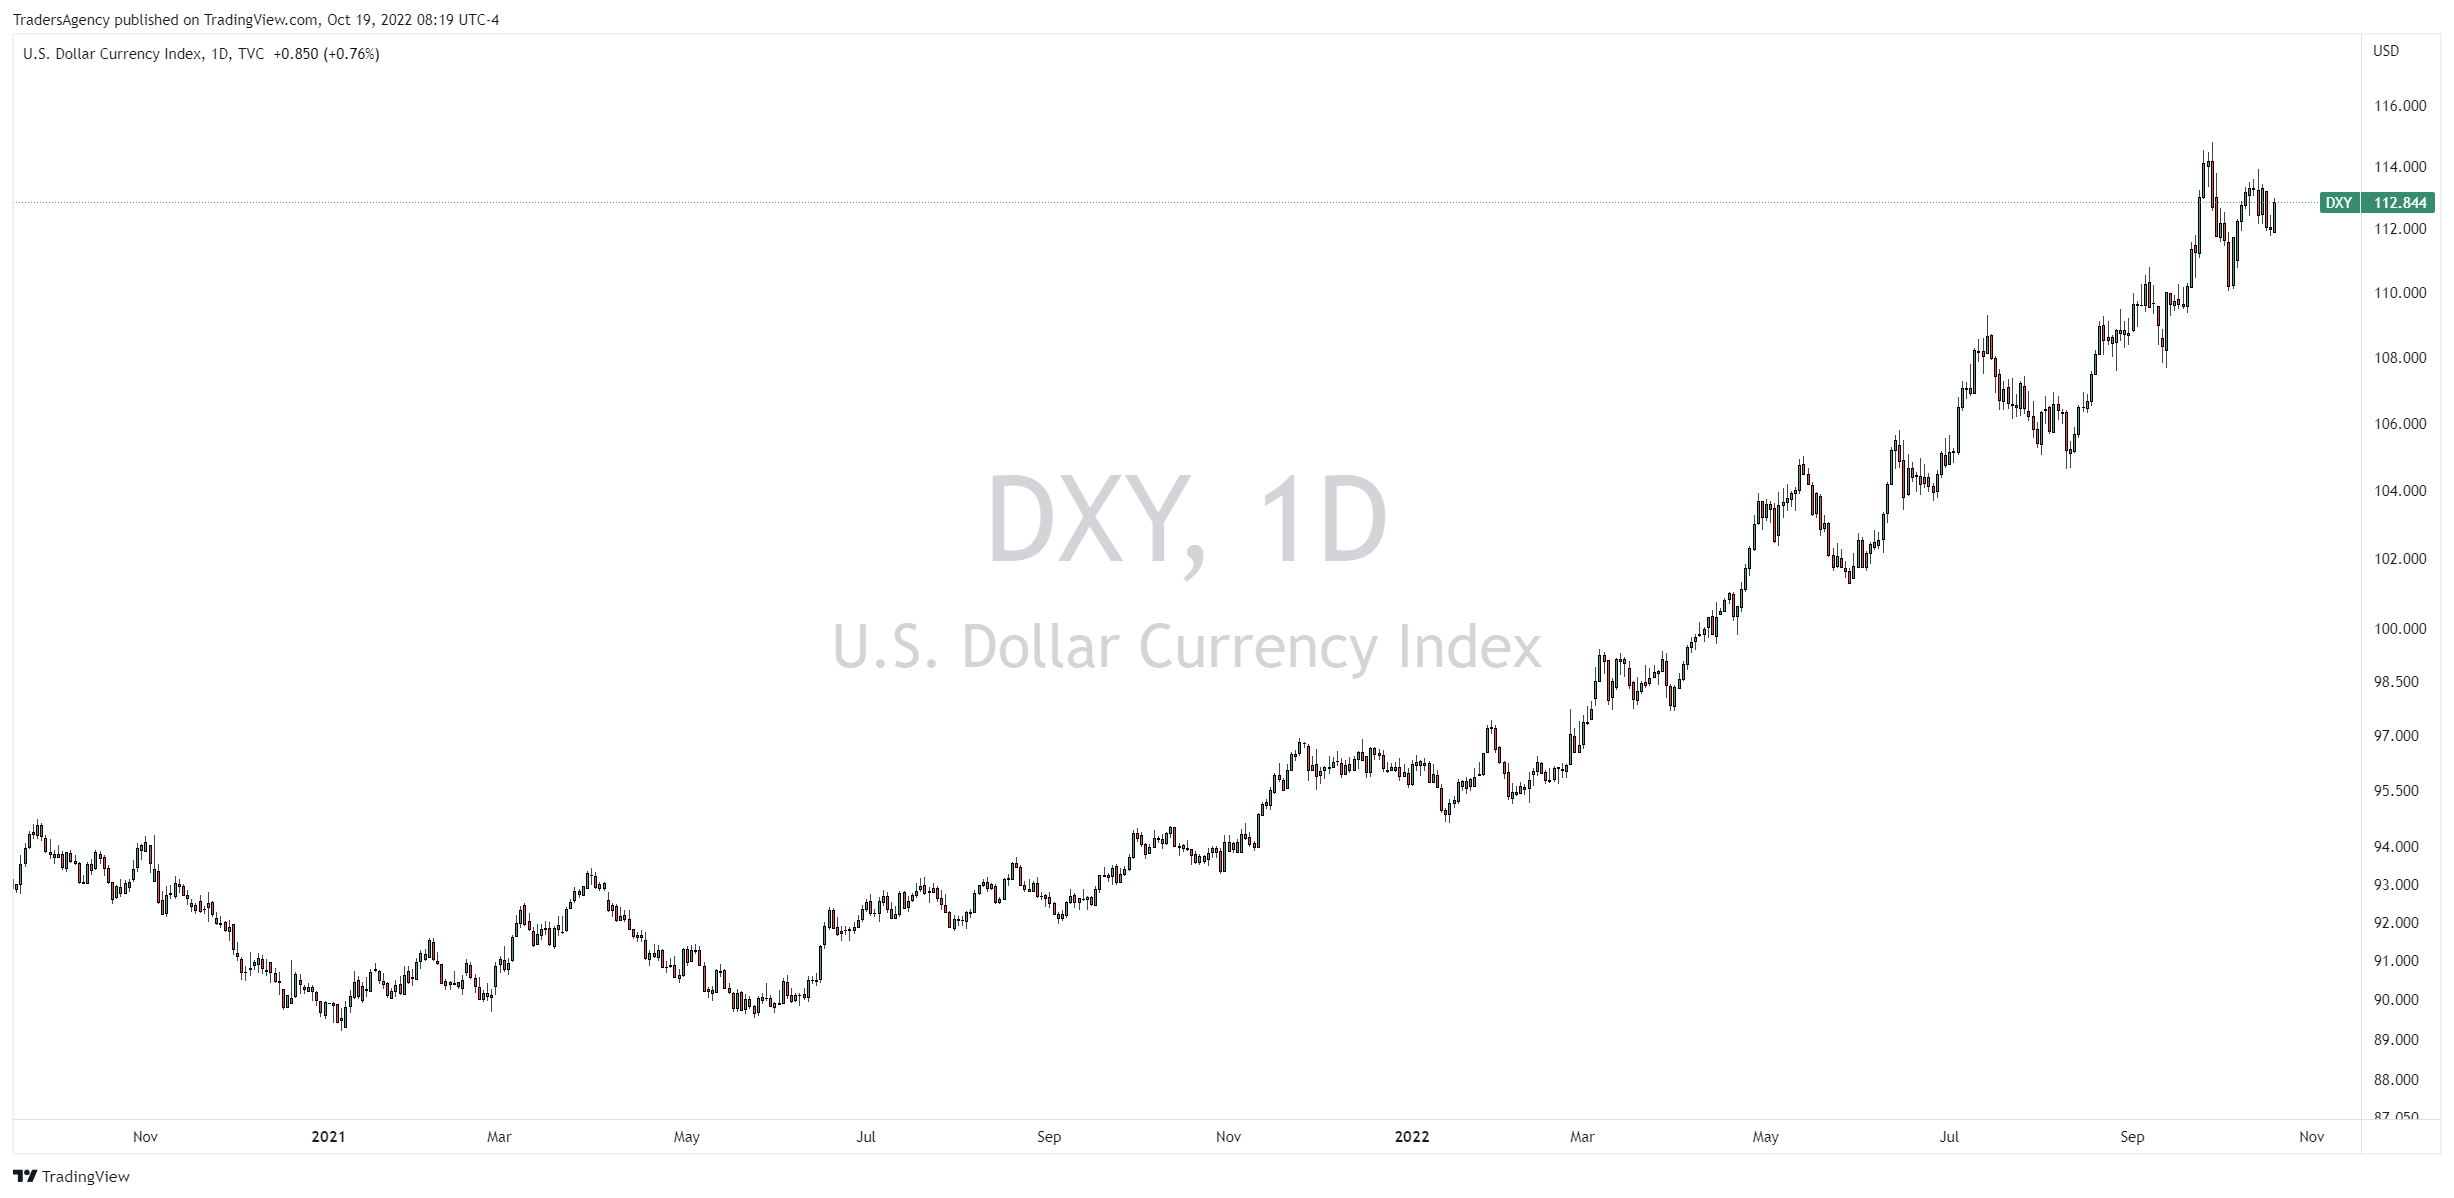
Over the last two years, the US dollar has grown to be very strong compared to many of the world’s leading currencies.

In the daily chart of the US Dollar Currency Index (DXY) above, you can see that the dollar has really soared in value over the last two years.
This has been a major headwind for BTC and other digital currencies that are priced in US dollars.
All else equal, a stronger dollar means it takes less dollars to buy one BTC, bringing the price down.
And if the dollar stays strong or continues to rise in value, it will only make BTC less valuable by comparison.
Support Starting to Weaken
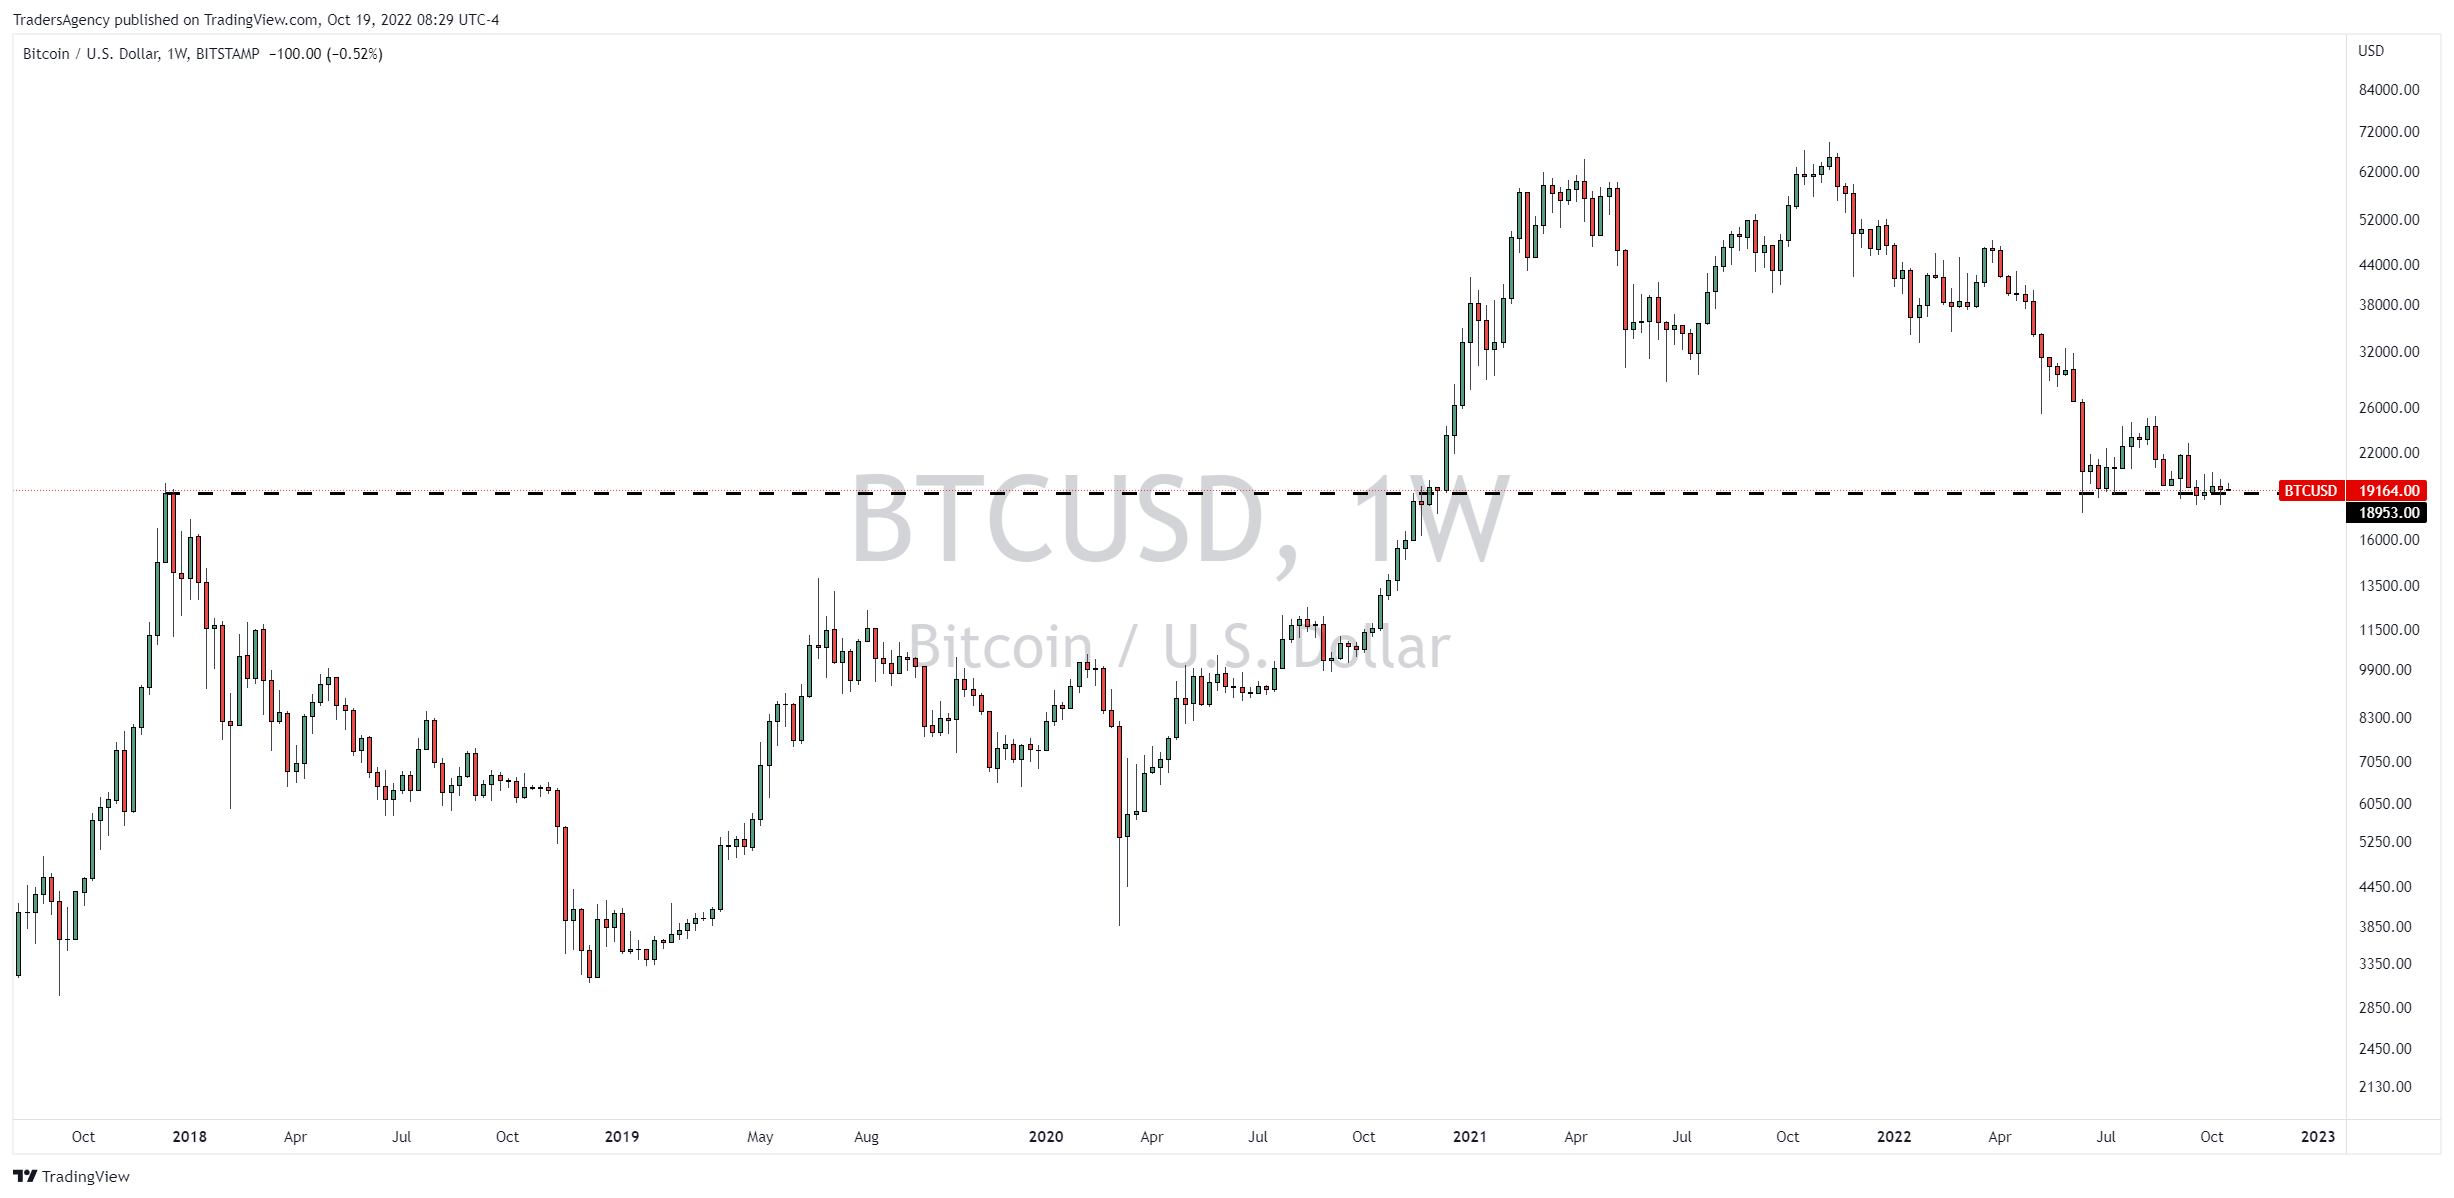
In the weekly chart of BTC below, you can see that the market is still hovering just above a key support level that stems from the 2017 peak.

This level looks at first like it could hold and send the market higher, but it doesn’t look so clear when you zoom in on the daily action…

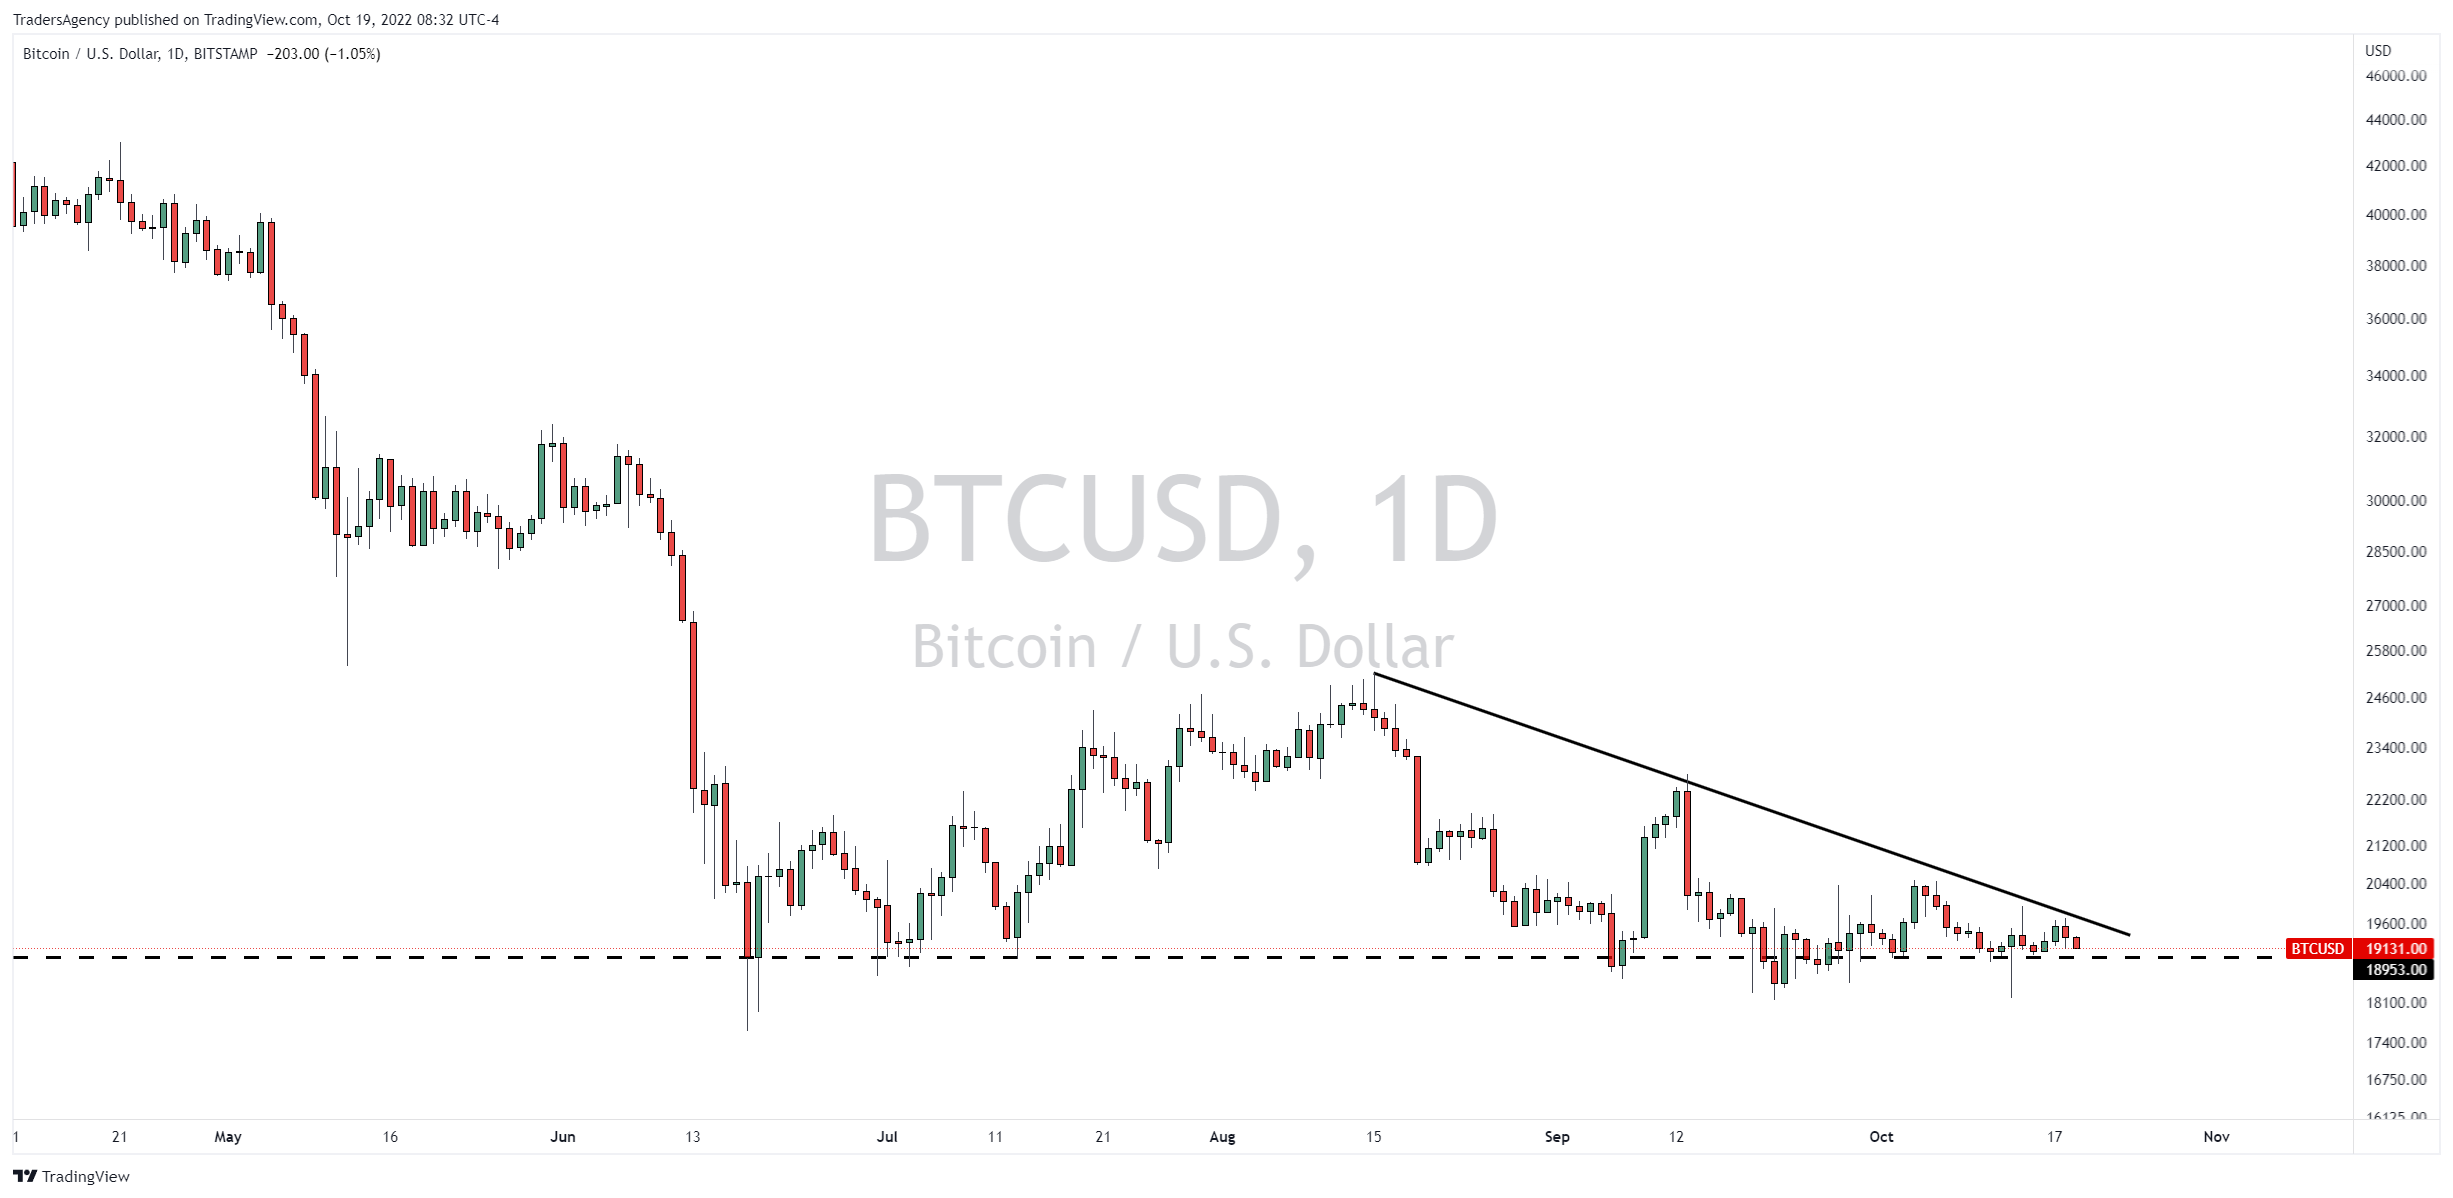
Over the past few months, BTC has been testing that same support level over and over again and has so far held above it for the most part.
However, in recent weeks, you’ll notice that the market has been making lower highs.
And that has created a down trending resistance line that is keeping a lid on all recent rallies.
A move above that level could change this situation, but right now I see a very tight market with a downward bias that looks ready to break below support at any moment.
Moving Averages Pointing Lower
Lastly, there’s another layer of resistance overhead that we can’t forget about…

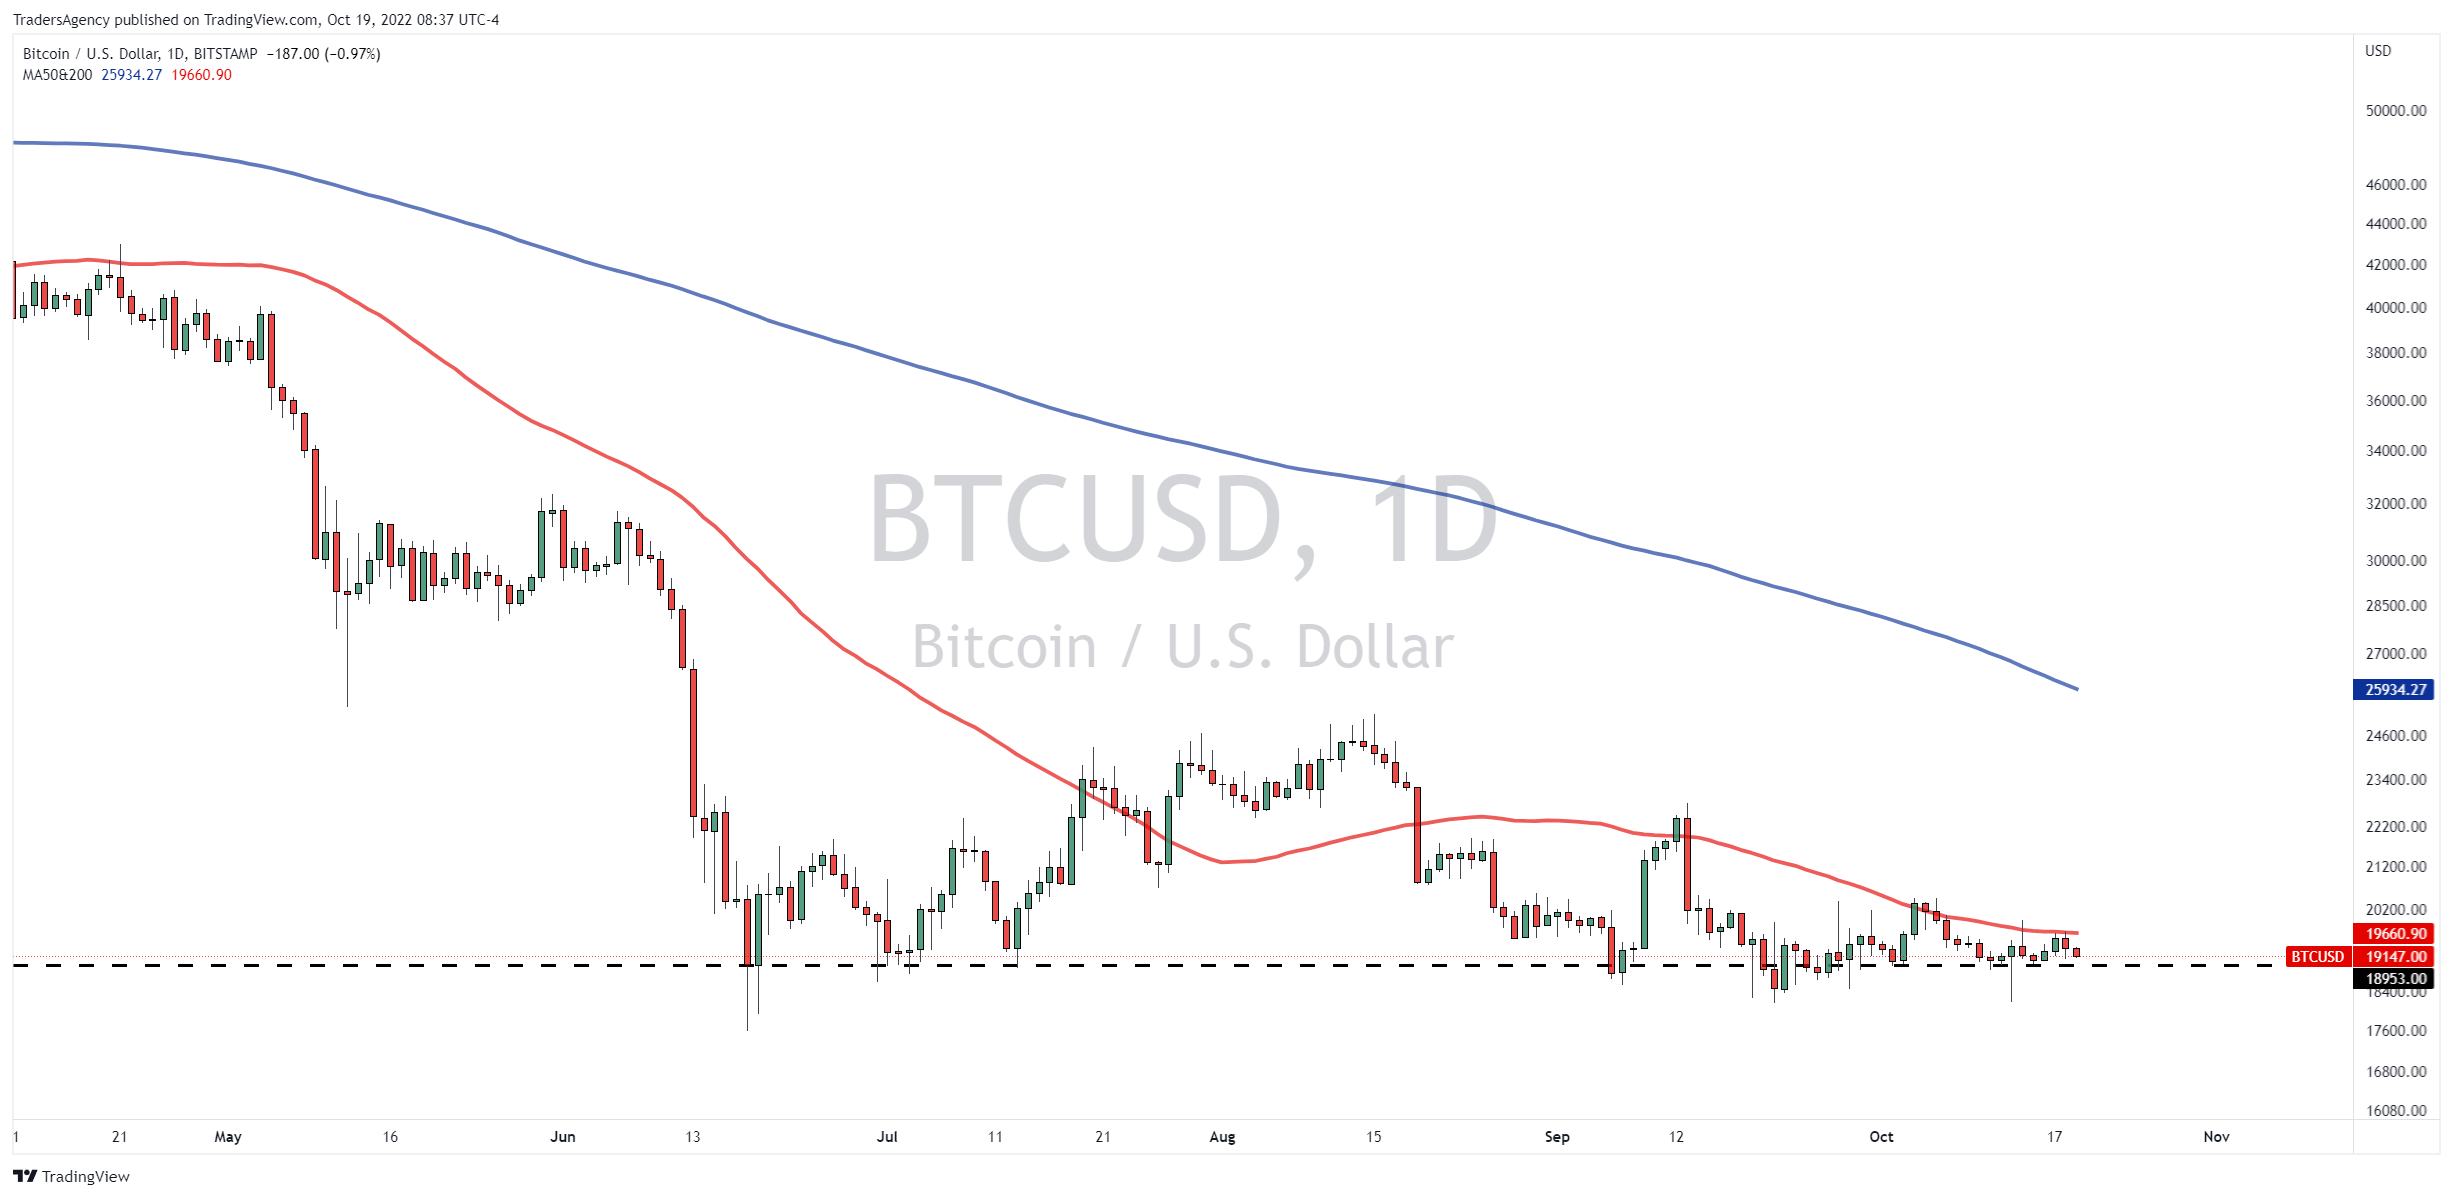
In this daily chart, I’ve added in the 50- (red) and 200-day (blue) moving averages.
As you can see, the market has not been able to get back above the 50-day since it broke down below that level in mid-August.
That’s not a good sign for the bulls…
And now, the market is getting squeezed into a very narrow consolidation range between the 50-day moving average and the key long-term support level we discussed above.
This is usually the kind of tightening price action we like to see on stocks that are rising, as it indicates that a big move higher will be coming shortly.
However, in this situation, the path of least resistance is to the downside, so I would not be surprised at all to see a big, dramatic break below support when this consolidation finally resolves itself.
Trade with the Tide
Now, my colleague and expert trader Josh Martinez happens to agree with me about this market…
He’s set his target for BTC all the way down at the $11,000 level, which represents a potential drop of over 40% from current levels.
And when it gets there, he’ll be waiting to play it with his Tunnel Trader strategy.
You see, if you are looking for a system that can help you start racking up more consistent wins on the downside as well as the upside, you need a way to find intraday opportunities…
That’s what Josh’s Tunnel Trader strategy is all about.
Utilizing this strategy, Josh has been identifying shorter-term up and down entry and exit levels for profitable trading opportunities along the way as markets move toward their full price targets.
Josh is going to teach you the simple, systematic approach to trading that is the basis of his Tunnel Trader tool.
If you can follow basic instructions, you can definitely follow along with Josh as he walks you through his approach.
So, don’t wait…
Register for today’s 12 p.m. ET session with Josh and his team by clicking right here.
Embrace the surge,
Ross Givens
Editor, Stock Surge Daily


