Hey, Ross here:
For the last day of the trading week, let’s look at some historical data to see what the market usually does after four months of impressive gains.
Chart of the Day

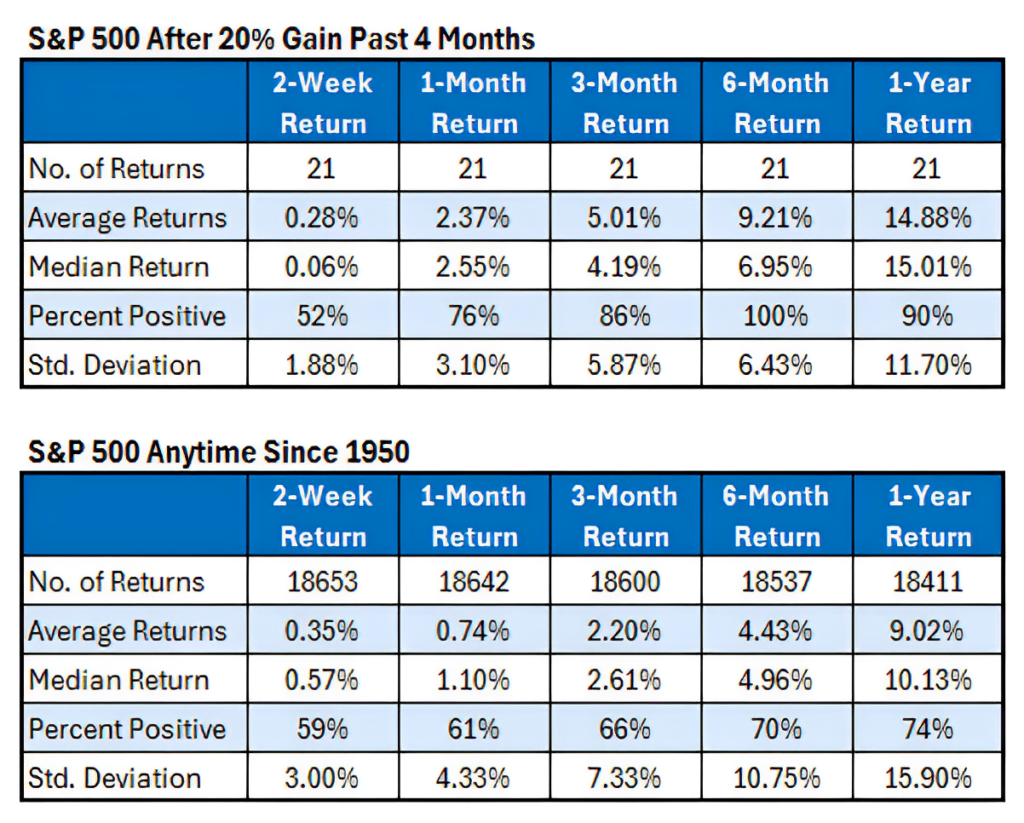
The S&P 500 is up 20% over the past four months. Let’s put that in a long-term context.
As you can see, in all 21 of the previous instances of the S&P 500 going on a 20% four-month run, its average/median return over the next year is 15%.
This is substantially above the S&P 500’s typical one-year return of about 10%.
In short, the most likely scenario for the market one year from now is for it to be up by double-digits. Yes, that includes all the pullbacks along the way.
But here’s the important bit – if you want market-beating returns – you can’t just be looking at the market.
Insight of the Day
Different sectors lead different bull markets higher.
The data shows that the bull market will likely continue.
But what it doesn’t show is which sectors will lead the market higher.
Many bull markets look the same when you just look at the surface-level details like the returns and time period.
But when you peer under the hood, you’ll see that different sectors are the ones leading the bull market up (and other sectors are the ones holding it back).
You want to make sure you’re positioned in the leading stocks in the leading sectors.
That’s how you do great while the market is doing good.
And that’s why in just a bit at 11 a.m. Eastern later…
I’m going LIVE for a masterclass that will allow you to position yourself in the best of these leading stocks.
The strategy I’m showing could have allowed you to book a nearly 30% gain in a single day earlier this week…
So make sure you click here to guarantee your spot in my masterclass later…
And my team will shoot you the login details in just a bit.
I’m sending this newsletter out early so you get the chance to lock in your spot and not miss out.
See you there.
Embrace the surge,

Ross Givens
Editor, Stock Surge Daily


