Hey, Ross here:
And let’s start the last day of the trading week with a chart that shows just how far the market has come this year.
Also, just to let you know – this newsletter will be taking a break both Monday and Tuesday next week.
So have a great 4th of July weekend – catch you in your inbox on Wednesday.
Chart of the Day
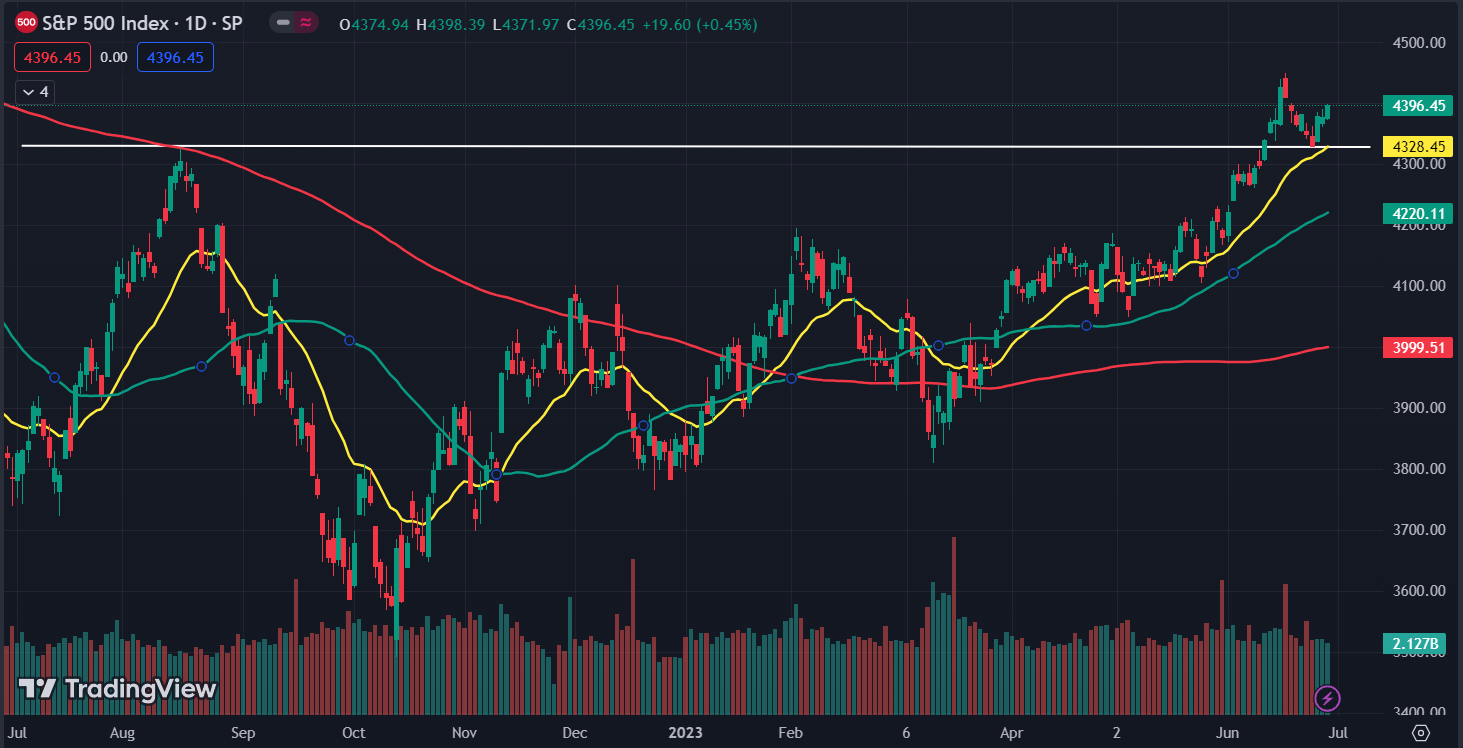
Above is the chart of the S&P 500 going back one year.
The white line is the level formed by the highs hit in August 2022.
And as you can see, the August highs have now become a support level, with the recent market pullback bouncing almost perfectly off this level.
All I can say is – does this look like a repeat of the 2022 bear market to you?
Insight of the Day
Don’t confuse conviction with stubbornness.
As traders, we must have conviction in our strategy.
But we shouldn’t confuse conviction with stubbornness.
Just look at all the people still crying that the market is going to crash (despite the beautiful chart I shared above).
How much gains have they given up by sitting on the sidelines waiting for the market to crash?
And the more they stubbornly stick to their bearish views, the harder it is to change them – and the more gains they give up.
That’s the price of stubbornness.
That’s why I always keep my views on the market flexible.
Yes, I’m a bull right now because that’s what the data is telling me.
But if the data no longer supports my view, I’m more than happy to change it.
I go where the opportunities are – whether they’re long or short.
Right now, I’m going long – using my flagship strategy for spotting institutional buying to target fast gains.
And for a limited time only, you can click here to get this strategy for yourself for just 99 cents.
Embrace the surge,

Ross Givens
Editor, Stock Surge Daily


