Back in mid-September, we covered the “Descending Triangle” pattern.
As regular readers know, this is a continuation pattern, which means the breakout from the consolidation is typically in the direction of the market’s prior trend.
And because this is a bearish continuation pattern, I told you to move out of the way when you see one of these develop.
They can produce some really nasty declines, which is exactly what we have seen from one of 2022’s biggest losers…
Meta Misstep
I couldn’t have picked a better example to illustrate how powerful the descending triangle pattern really is…
The stock we looked at was Meta Platforms (META) — formerly Facebook — which just can’t seem to catch a break.
Last week, founder Mark Zuckerberg announced over 11,000 layoffs at the company, which equates to about 13% of the company’s staff.
In a letter to employees, he explained that he wrongly predicted that the boom in e-commerce during the height of the pandemic would be permanent.
He continued, saying, “I made the decision to significantly increase our investments. Unfortunately, this did not play out the way I expected.”
Well, that’s quite the understatement!
Tracking the Descent
The stock has dropped over 66% this year alone, which easily underperforms the returns from its mega-cap technology peers.
To really put it in perspective, this is what the chart looked like when I first brought the descending triangle pattern to your attention…
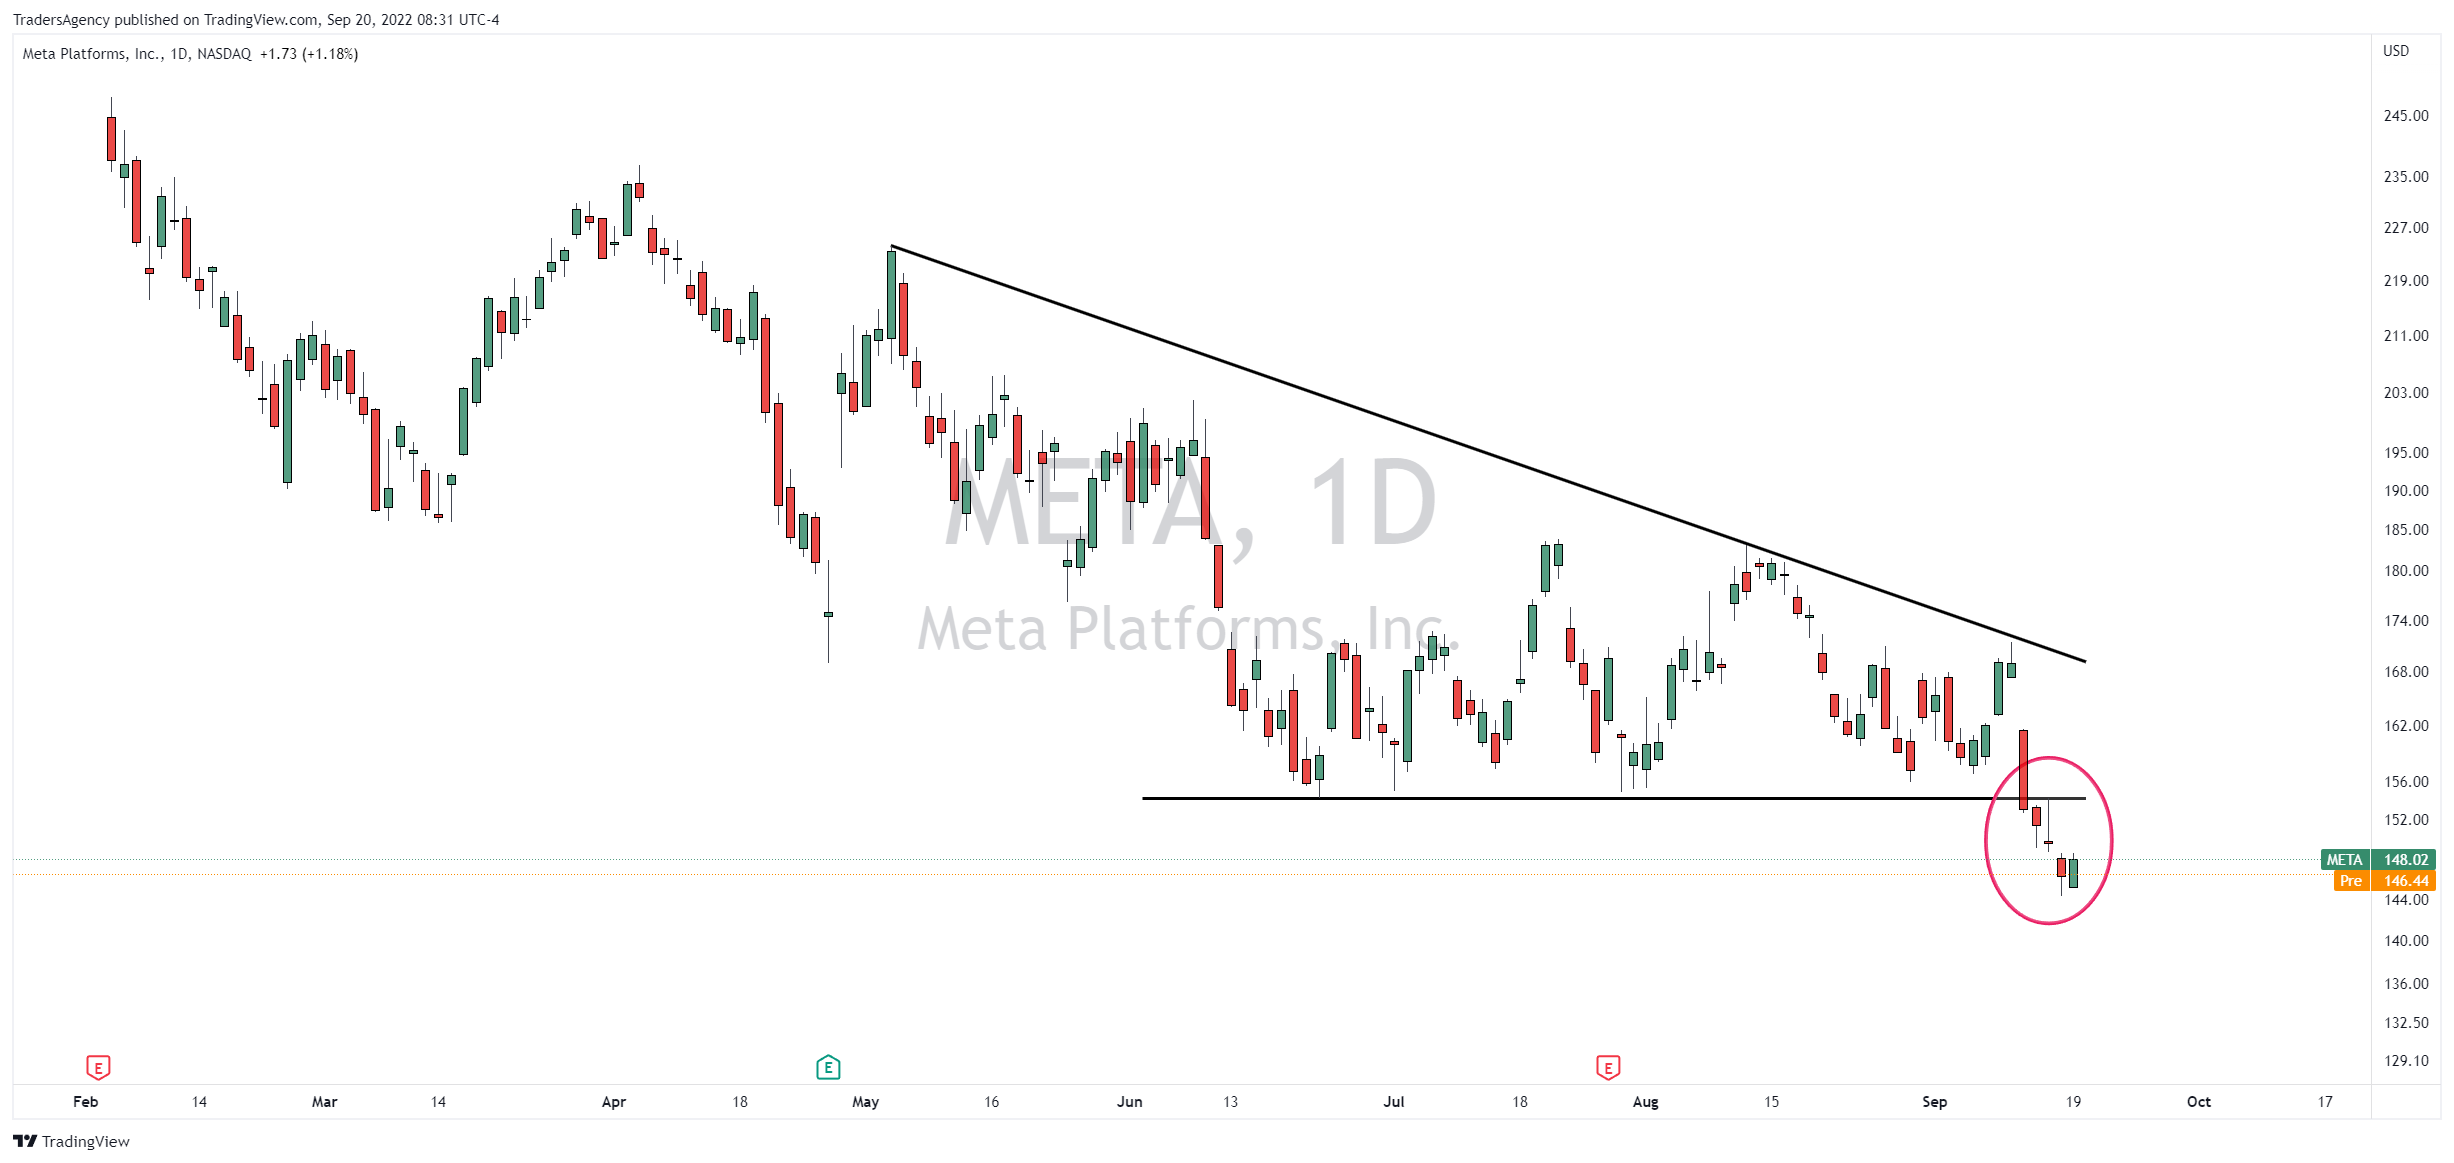
The stock was sitting at about $148 per share, just below the lower support boundary of the descending triangle pattern.
I explained that the rallies were becoming more and more shallow, indicating that there was more supply than the market could absorb.
I concluded by saying, “META’s next move lower may just be starting…”
Don’t Try to Catch a Falling Knife
Well, since the close that day, the stock fell as much as 39.7% before it was able to stage a bounce.
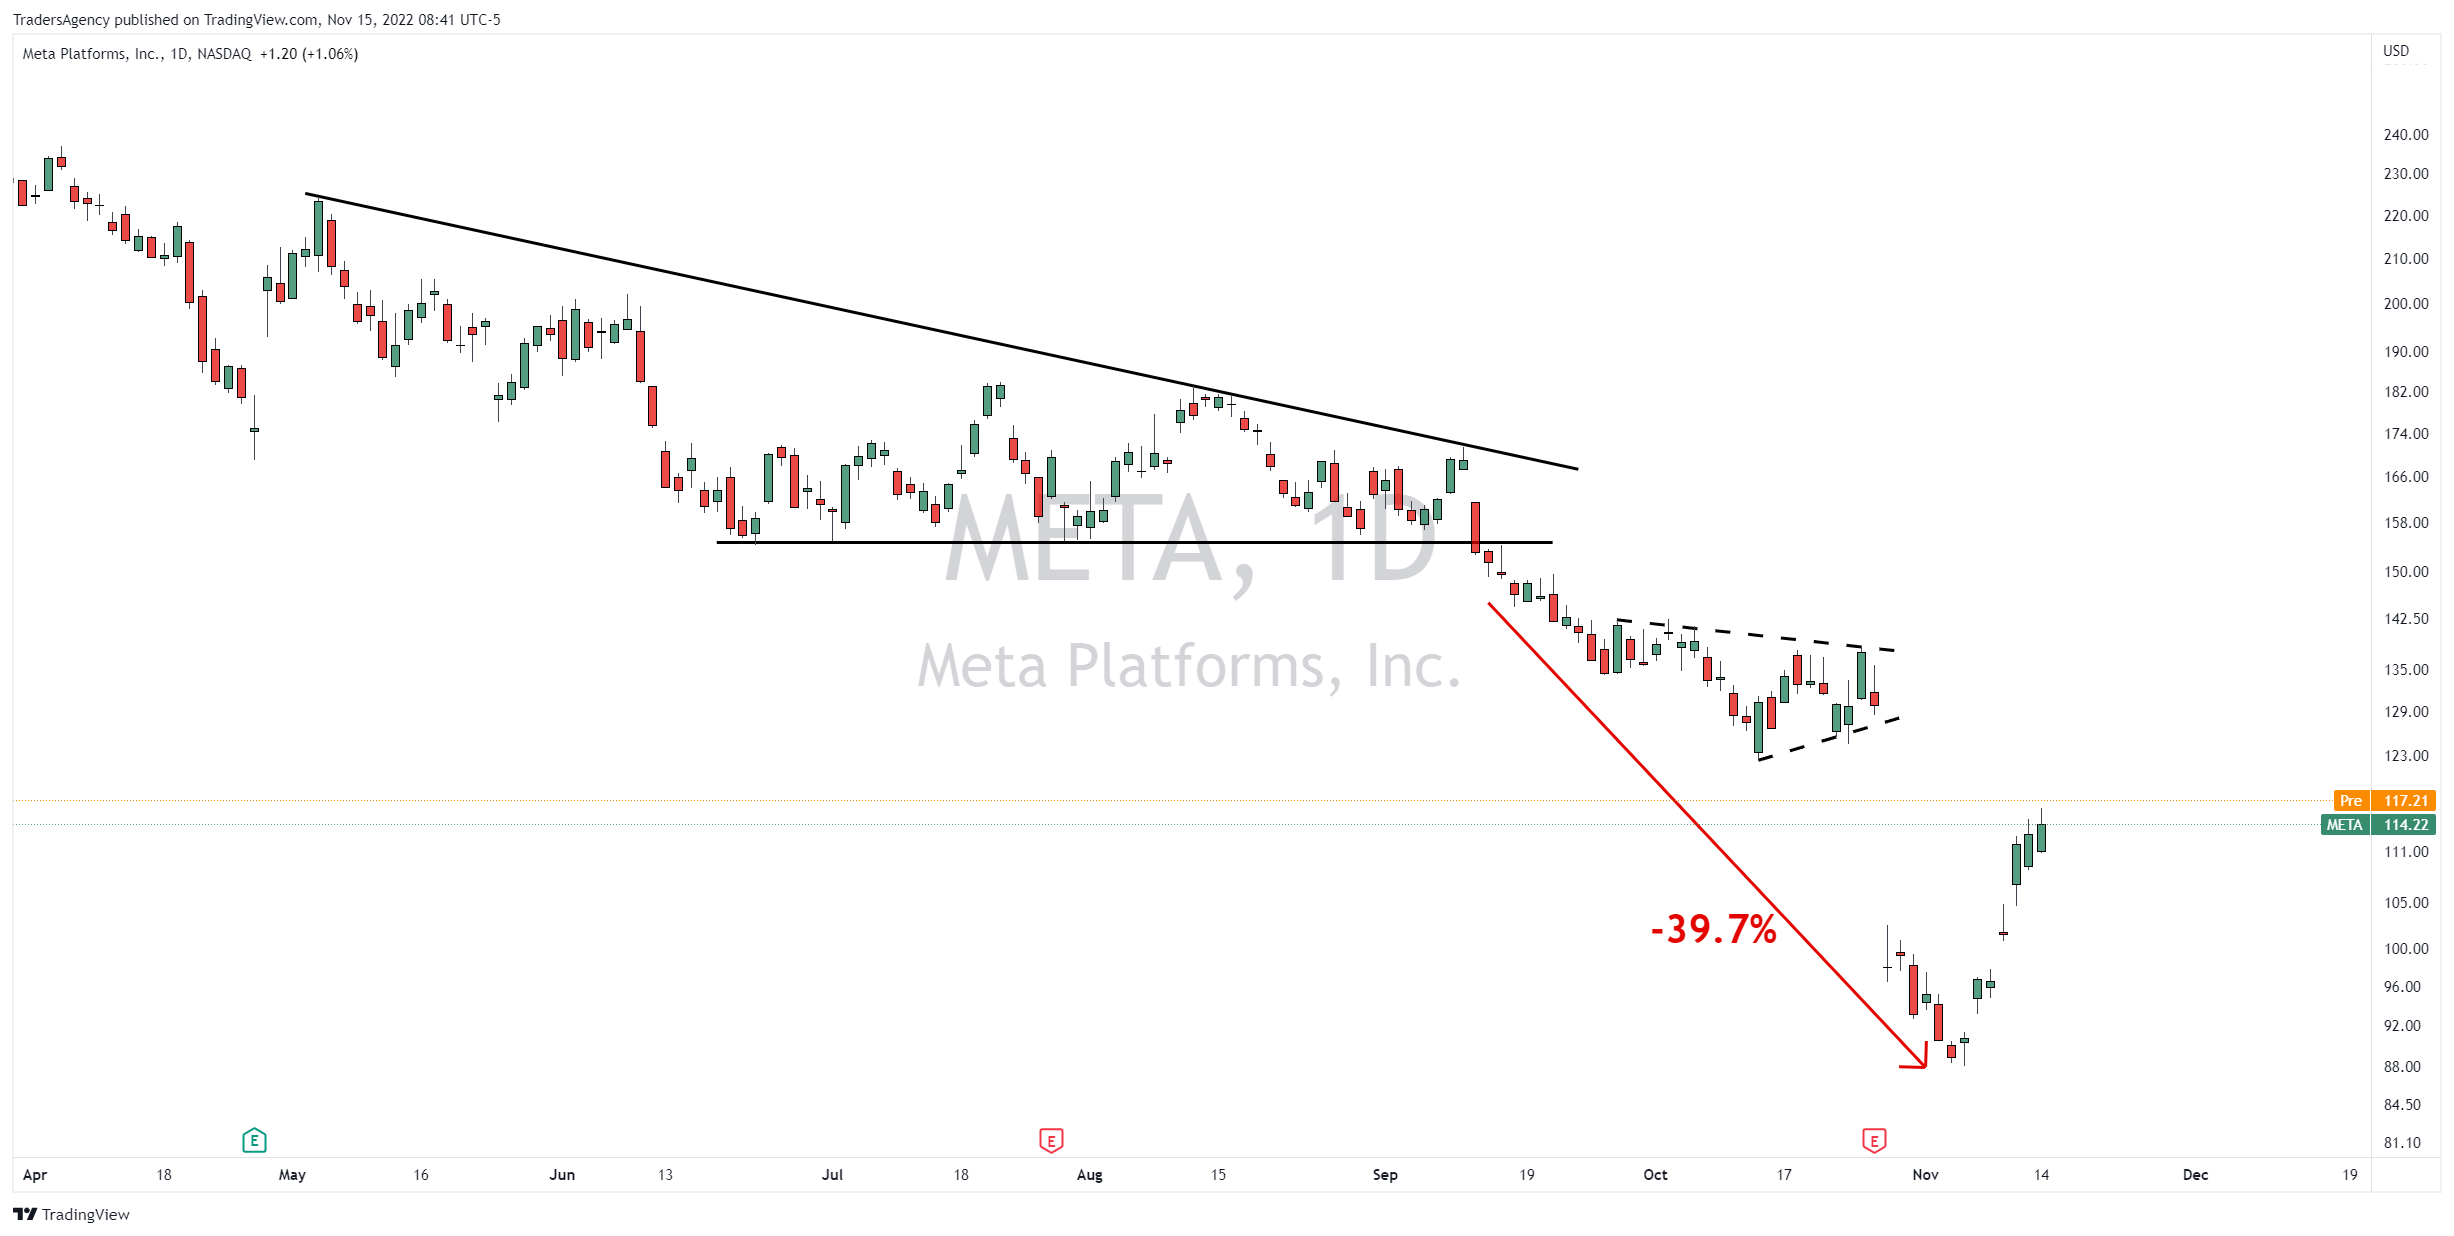
As you can see in the updated chart above, META made a bearish break from the descending triangle pattern and trended lower into mid-October.
Then, the stock tried to form another, smaller consolidation range for a few weeks just ahead of earnings season…
But when the company’s latest earnings announcement went live, shares broke out of that short-term range and plunged another 24.6% in a single session!
Not only is this a textbook example of how a descending triangle pattern is supposed to play out, but it’s also a great reminder that traders should never try to “catch a falling knife.”
Unless you happen to buy the exact low, which virtually never the case, you’ll be much better off going long on a stock that’s actually rising!
Follow the Insiders
Now, there is actually a way to know when the selling has gone too far and the buyers are ready to step back into the market…
When corporate insiders like CEOs, CFOs, executives and board members put down their own hard-earned money to buy shares of their own companies, it’s a huge vote of confidence.
After all, these folks have a footing of knowledge about their companies that Main Street investors simply do not.
It’s absolutely free to attend, so I really hope you’ll join me.
I’ll cover my strategy for trading alongside corporate insiders and generating potentially massive gains with less risk.
I look forward to seeing you there!
Embrace the surge,

Ross Givens
Editor, Stock Surge Daily


