Hey, Ross here:
And let’s start the day with a chart that bodes well for traders and investors alike.
Chart of the Day
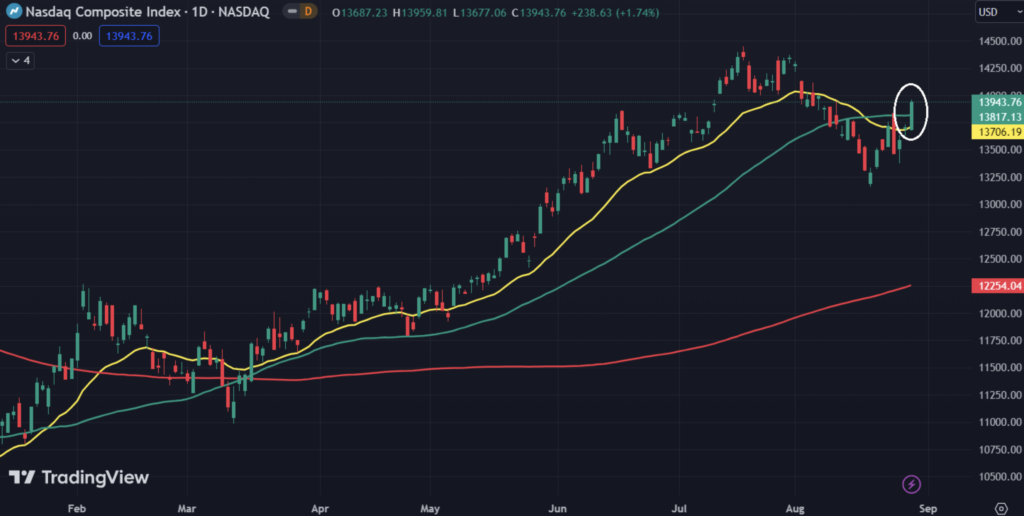
That’s the Nasdaq breaking through both its 21-day and 50-day moving averages (yellow and green lines, respectively) yesterday.
And it’s not alone, the S&P 500 and the Dow also did the same.
The market is now about 2–3% down from its July highs.
Market sentiment swung up big yesterday. The only question is – will it last?
That’s what I attempt to dissect in the Insight of the Day.
Insight of the Day
The market rising sharply yesterday on lower job openings is a good sign.
I said last week that in a downturn, we want to see the market going UP on BAD news – because that’s a sign the low is in, and buyers are returning.
That’s what happened yesterday after the latest data revealed job openings are at their lowest level in nearly 2.5 years.
Again, this is a good sign – but we don’t want to read too much into it.
I would still proceed with caution until I see clearer evidence this upswing can be sustained. As I said yesterday, I won’t be surprised to see a lot of “false starts” happening.
As always, I’ll keep you updated.
In the meantime, if you want to know which strategy I’m recommending right now – and why…
I’m going live later this evening at 7 p.m. Eastern to explain everything.
So click here to save your seat…
And I look forward to seeing you.
Embrace the surge,

Ross Givens
Editor, Stock Surge Daily


