We’ve talked about a lot of different technical chart patterns over the past few months.
We’ve covered a variety of bullish and bearish patterns as well as continuation and reversal patterns.
Learning to identify technical trading patterns is a task that will pay dividends over time…
But the individual candlesticks that form throughout each and every trading day have their own significant meaning as well.
Let me show you…
What’s a Candlestick?
While there are different ways to display stock charts, the most popular these days a candlestick chart.
You’ve seen these candlestick charts before if you’re a regular reader of Stock Surge Daily.
But for everyone else, here’s a quick example of a candlestick chart showing the Nasdaq 100…
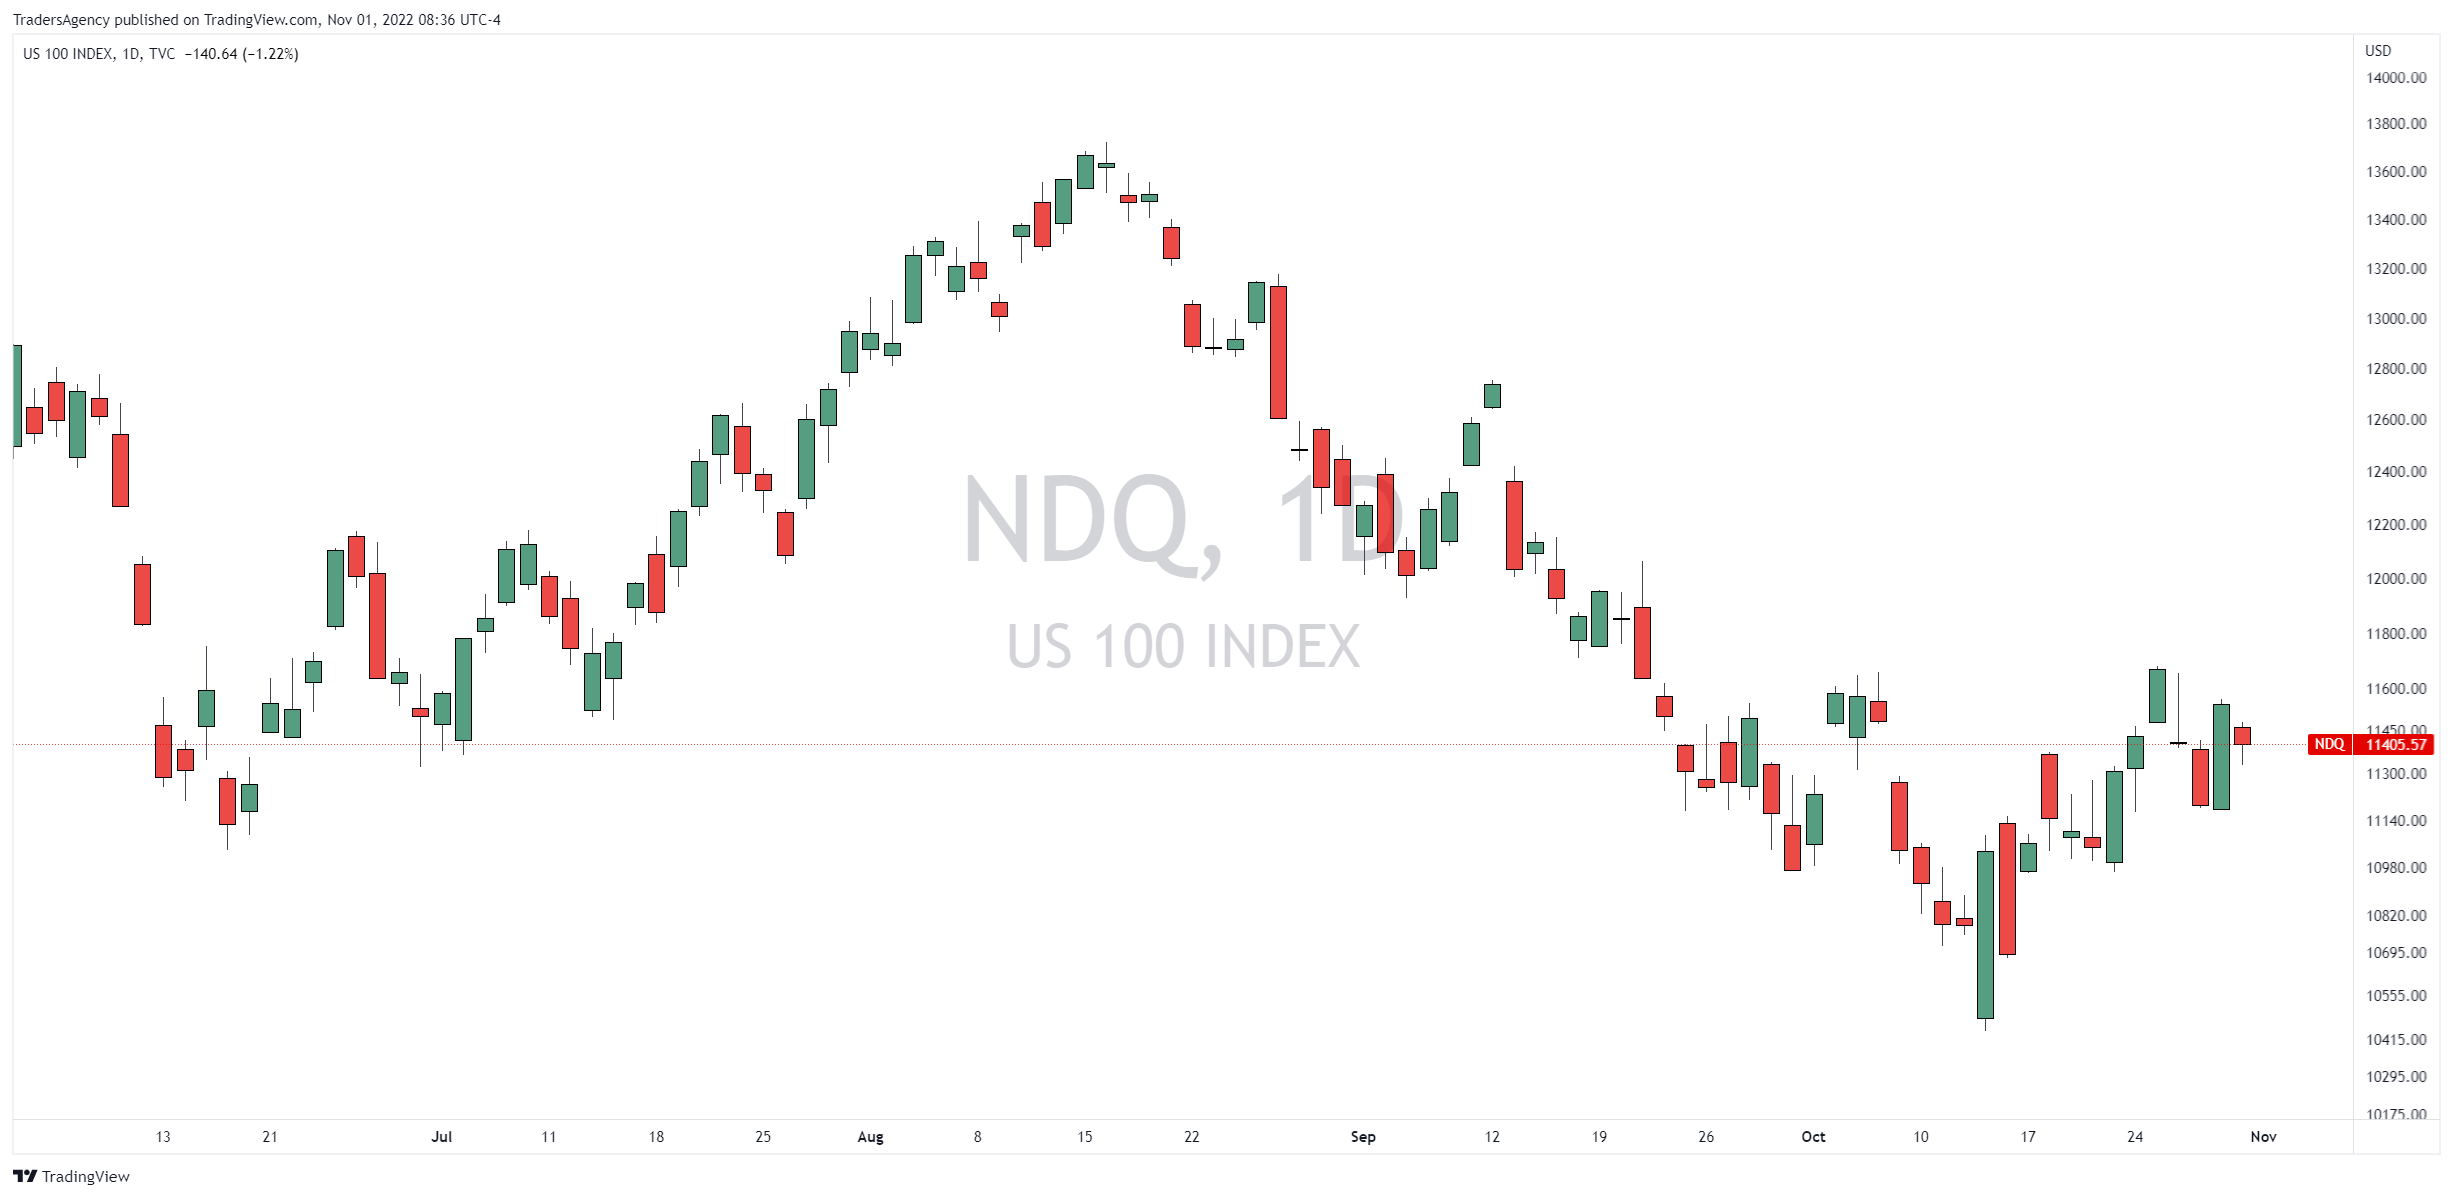
In this example, each candlestick represents one day of price action.
But regardless of what period of time the candle covers, it tells us four main things about the price action:
- Open Price
- Close Price
- High Price
- Low Price
Here’s a closer look…
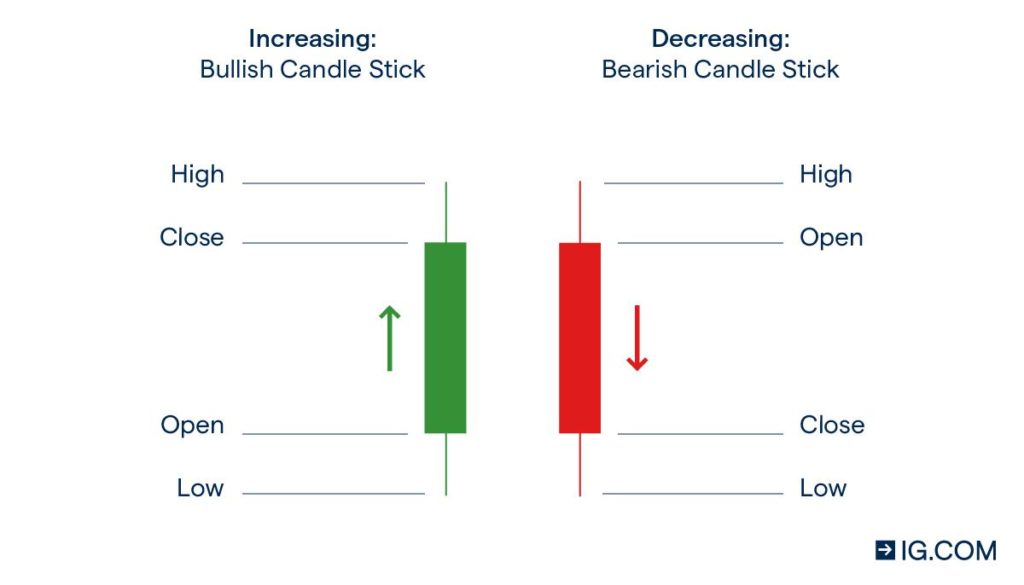
Generally, a candlestick will look like what you see in the image above…
The market candlestick looks a lot like a real candle, as it is made up of a body (shaded area) and a wick extending from each end.
Candlestick Components
The body of the candlestick shows where the market opened and closed over the specified time period.
When the close is higher than the open, it creates a bullish, green candlestick that indicates price is rising.
And when the close is lower than the open, it creates a bearish, red candlestick that indicates price is dropping.
The wicks on either end of the body represent the high and low prices over the specified time period.
If a market is experiencing particularly volatile price action, the body is typically larger, and the wicks can get fairly long on each end.
On the other hand, if a market is very quiet, the body and the wicks are likely to be much smaller.
Going back to the Nasdaq 100 chart above, you can see that candlesticks come in all different shapes and sizes.
Each individual candlestick has its own meaning, but we can learn even more about price action by looking at candlesticks in context.
We’ll cover many of these candlesticks in future issues and explain how they work together to provide valuable trading information, so stay tuned!
Trade with the Insiders
It’s clear that candlesticks have huge potential embedded in them, and they reflect traders’ expectations about the market.
But if you want a more fundamentally driven strategy for getting ahead of big market moves before they happen, consider this…
When corporate insiders like CEOs, CFOs, executives and board members put down their own hard-earned money to buy shares of their own companies, it’s a huge vote of confidence.
After all, these folks have a footing of knowledge about their companies that Main Street investors simply do not.
It’s absolutely free to attend, so I really hope you’ll check it out.
I’ll cover my strategy for trading alongside corporate insiders and generating potentially massive gains with less risk.
Just click here to register for this special Insider Effect LIVE session now!
Embrace the surge,

Ross Givens
Editor, Stock Surge Daily


