About a month ago, I wrote an article called, Three Big Reasons Why The S&P 500 Could Fall Further.
We looked at the S&P 500 index alongside the S&P 500 Volatility Index (VIX) as well as market breadth.
Putting all three together, it was clear to me that stocks were in for further selling at the time, and that’s exactly what happened.
Since that article was published on May 12, the S&P dropped further by as much as 5% and is still down about 3% as of yesterday’s close.
While there was about a one-week rally mixed in there, our analysis was largely correct.
So today, I want to revisit each of the factors we talked about last time and see how they’re setting up today…
The Weekly Picture
First, let’s look at an updated weekly chart of the S&P 500 Index.
I mentioned before that every time the S&P closes below its 50-week moving average (MA) for at least two weeks in a row, the index falls to, near or below its 200-week MA.
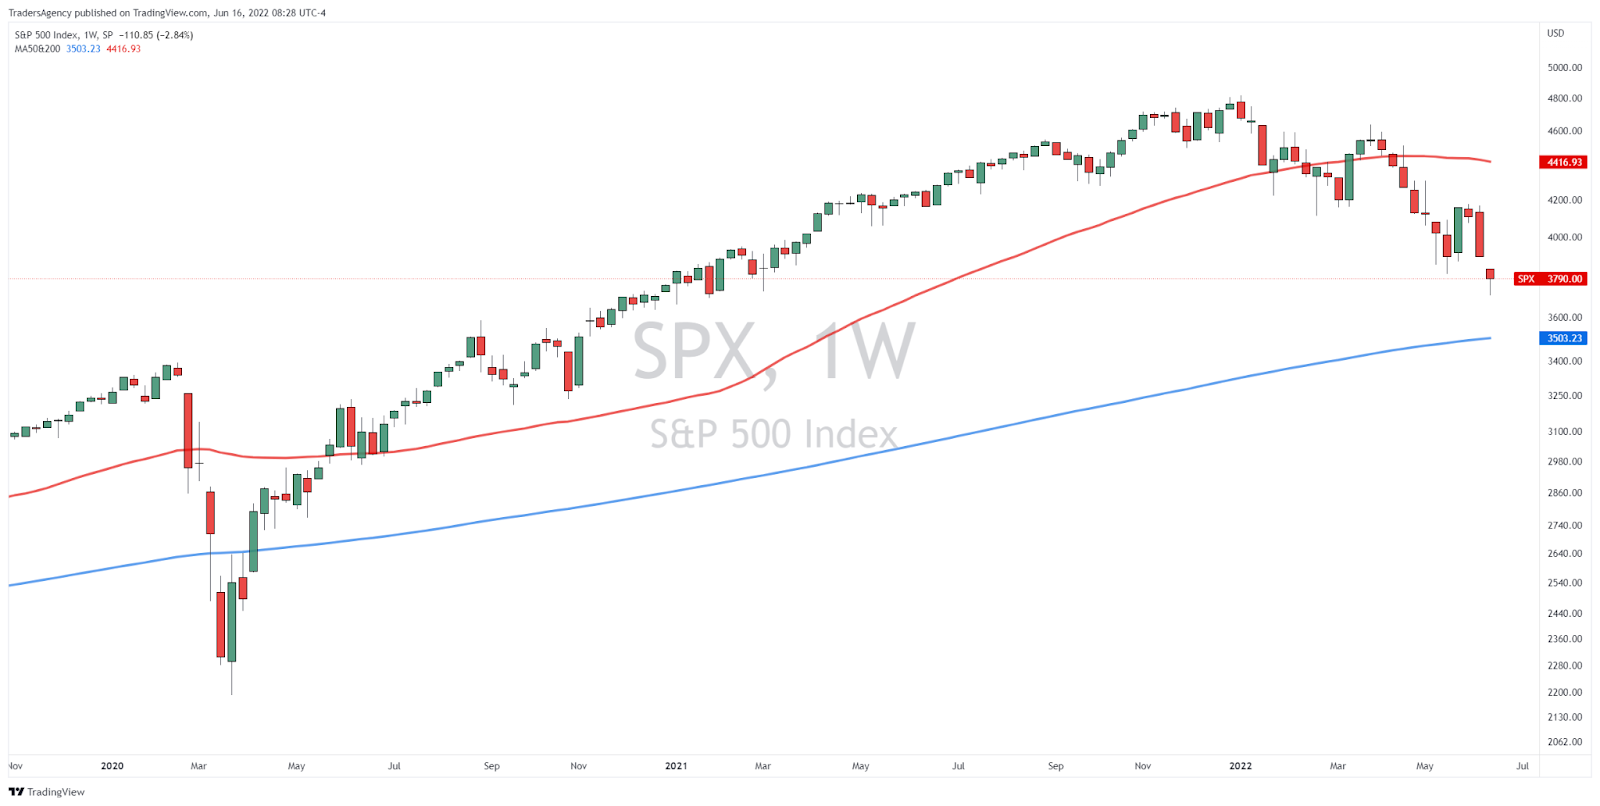
As you can see in the chart above, the index has made further progress toward the 200-week MA since the original article.
At that time, the S&P was about 11% above that level, but it is now only about 7.5% above it.
Of course, the 200-week MA itself has been trending higher little by little each day. But the drop in the market is really what’s closing that gap.
With futures down hard again this morning, I’m still expecting more downside ahead, and I wouldn’t be surprised to see the 200-week line tested in the coming days or weeks.
Volatility Surge?
Next, let’s revisit the S&P 500 Volatility Index (VIX).
As many of you know, the VIX is sometimes called the market’s “fear gauge,” and it’s typically inversely correlated with the S&P 500.
In other words, when the S&P 500 moves down, the VIX tends to move up, and vice versa.
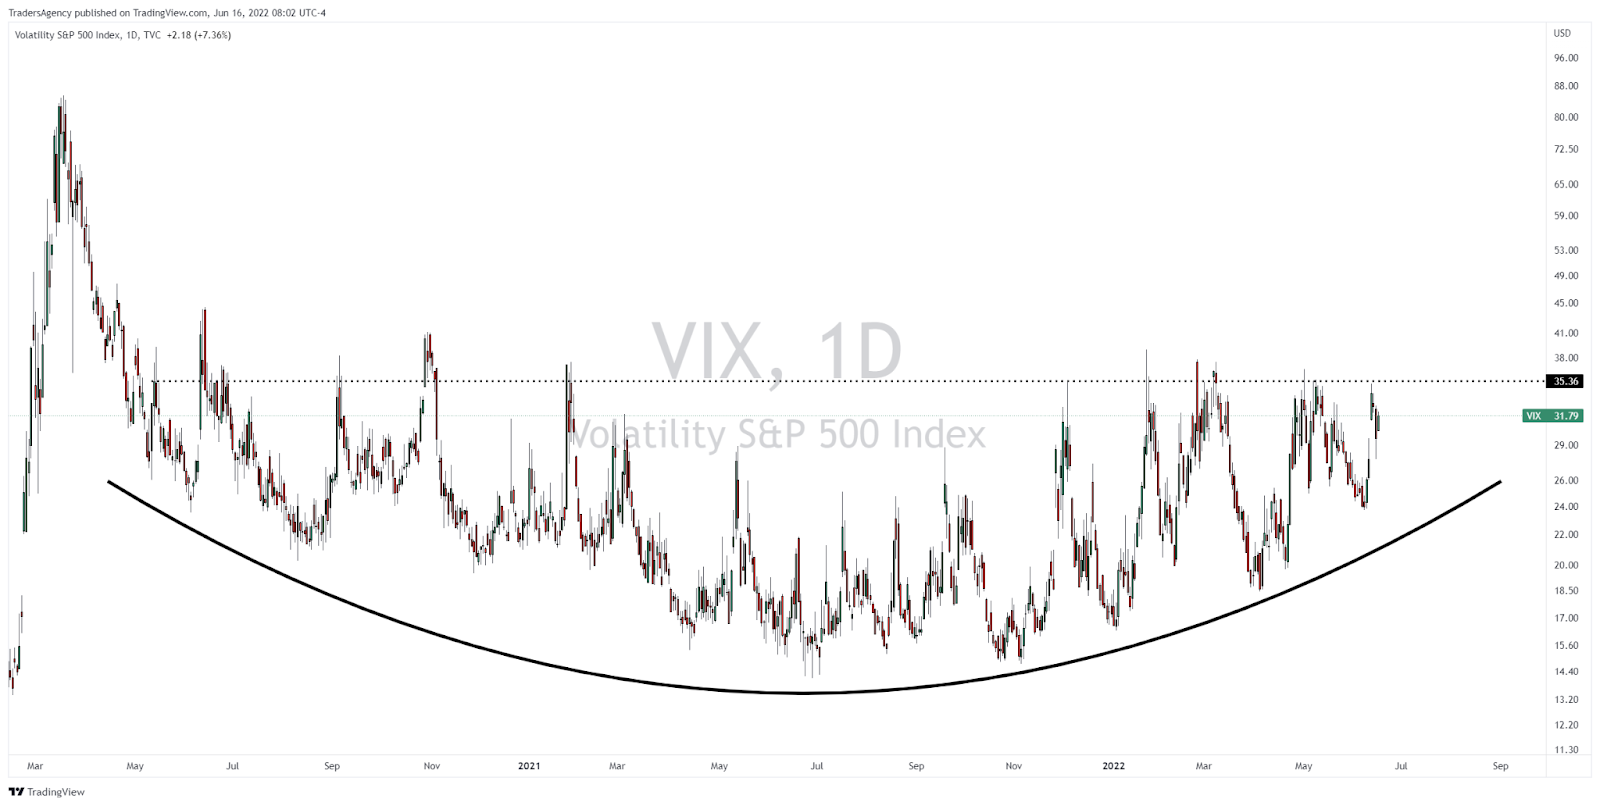
Since the last time I showed this chart, the VIX pulled back from the horizontal level around 35, put in a higher low on June 8 and bounced back up to 35 again.
Now, I need to mention that the VIX doesn’t really break out and run like stocks since it has a baseline.
In fact, a VIX over 30 normally means we could see an oversold bounce higher, which is basically what happened in late May leading into June.
However, the VIX is back to the 35 level again as I mentioned, and the S&P just registered a new 52-week low this week.
Bottom line… Even if there is no breakout, as long as volatility remains elevated, it’s going to be difficult going long in this market.
Market Breadth
Lastly, let’s look again at market breadth, which will give us a better idea of how individual stocks in the S&P 500 index are faring.
Unfortunately for the bulls, the answer is they’re not doing so well.
However, this could turn out to be a contrarian indicator…

The last time we looked at this chart, the percentage of S&P 500 stocks trading above their 200-day MAs was about 30%.
That is a pretty low reading, sure. But another look at the chart above shows that most market declines don’t end until that percentage reading hits about 20% or lower.
And for the big crashes, like 2008 and 2020, that percentage bottoms out in the low single-digits.
Now that more individual stocks are falling as the selloff runs its course, the reading has dropped from 30% to about 16%.
Fortunately for the bulls, however, this reading falls into the zone where the market typically bottoms, as you can see by the horizontal dashed lines on the chart.
The 2011 decline hit a low reading of about 9%, the 2015-2016 decline bottomed around 13% and the 2018 decline fell to a low around 9% as well.
Unless this turns into a major crash, I would expect the percentage of stocks above their 200-day MAs to stop dropping and eventually turn higher as the market tries to put in a bottom.
How long that takes is still anyone’s guess…
Waiting for the Bottom
As you saw in Monday’s Watchlist, we’re back to trading on the short side right now. Until we find a real bottom, I feel this is the appropriate strategy.
And unless we start to see massive buying by institutions, we won’t know for sure that the real bottom is in.
I’m talking about hedge funds, pension funds, endowments and other trillion-dollar organizations that are eventually going to start scooping up stocks at value levels.
And when they put their money to work, following their lead can pay off big time.
This is exactly what I focus on in my premium Stealth Trades research service.
So, if you’re interested in giving it a try, click here now to view my latest presentation.
Embrace the surge,

Ross Givens
Editor, Stock Surge Daily


