Hey, Ross here:
Right now, options traders are still pricing a 95.8% chance that the Fed cuts rates next month.
Should rates fall, liquidity – aka the amount of cash sloshing around – will increase.
But even though that hasn’t happened yet…
The market is already flush with cash.
Take a look below.
Chart of the Day
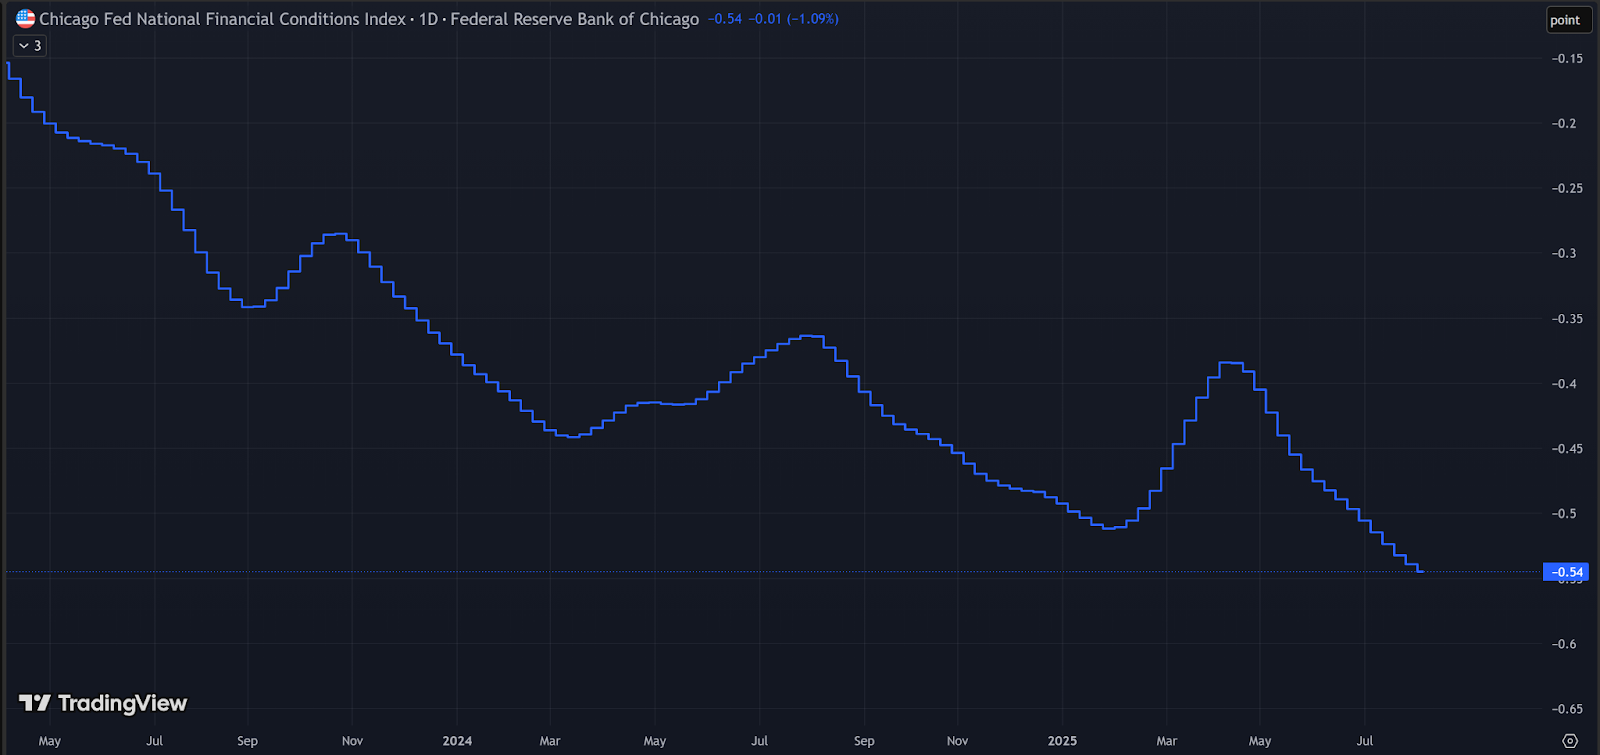
This is NFCI – the Chicago Fed National Financial Conditions Index.
The lower the chart, the more liquidity there is in the market (which is good for stocks).
As you can see, the NFCI spiked from March to April – in line with the short bear market earlier this year.
Since the April lows, the NFCI has been steadily falling – indicating better liquidity. It’s now at the lowest level in years.
And despite the market stalling a little in late July and August, you can see the NFCI just kept moving down.
That’s a very positive sign for the market.
The money supply has also reached a new all-time high.
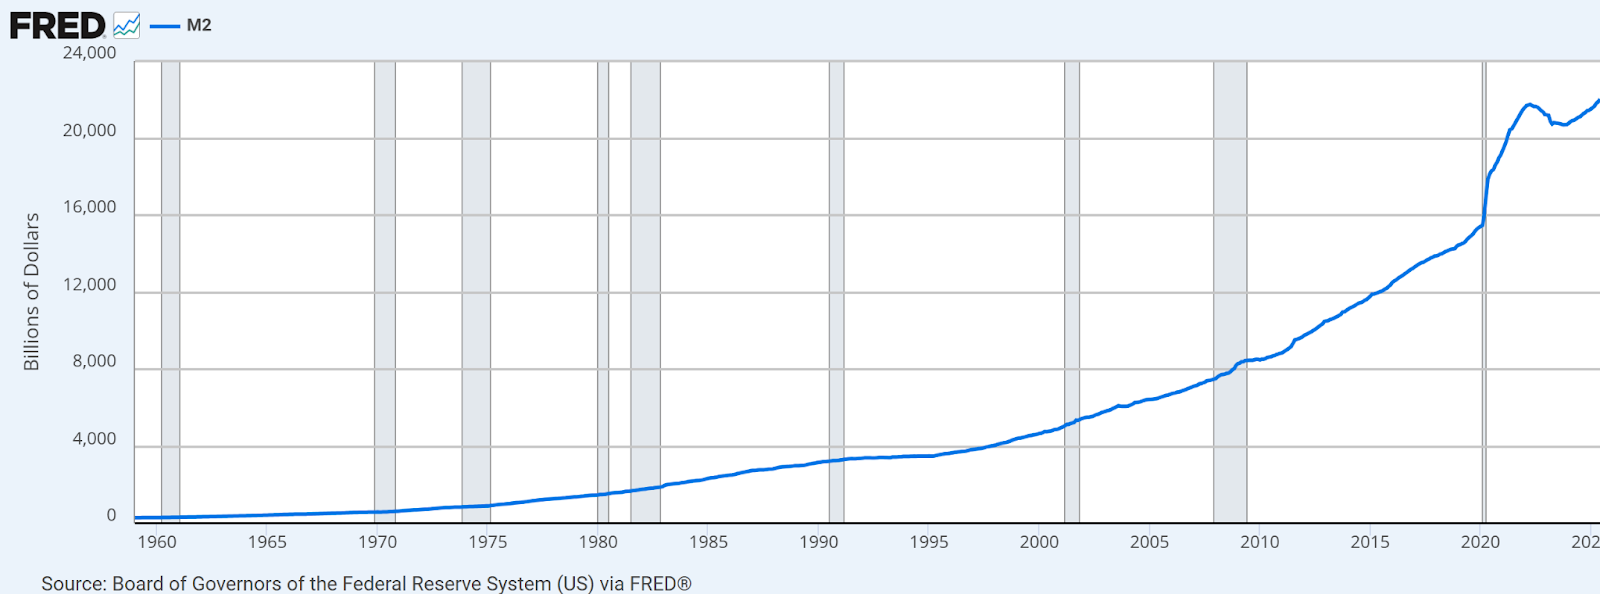
This may not be the best thing for the long-term health of the country as a whole.
But it’s great for stocks.
As I said, the market is increasingly flush with cash…
And that’s before any rate cut.
P.S. Ever kicked yourself for missing this newsletter? Text the word “trade” to 87858 and that won’t happen again.
Insight of the Day
The effects of increasing market liquidity will not be felt equally.
Don’t get me wrong…
The megacap tech stocks will likely capture a commanding share of increasing liquidity.
That’s just a natural function of their market dominance.
But what matters to us is the effect of this liquidity boost on their stock prices.
Considering that these megacaps are already worth trillions, the effect on their prices – from a percentage standpoint – is likely to be small.
But the effect of this liquidity boost on the prices of small-cap stocks could be dramatic…
Even if they are only capturing a small share of the overall liquidity.
That’s where we want to focus our efforts…
Small-caps that could already be on the verge of breaking out…
Where it just takes a bit of a cash inflow to send their prices surging.
And tomorrow, Friday August 15, at 11 a.m. Eastern…
I’m hosting a LIVE training session to demonstrate exactly how to do that…
By scanning for specific “pressure points” that could tell us when a stock’s price is about to explode.
The strategy I’ll be showing has led to rapid gains like 77% in 21 days, 51% in 15 days, and 87% in 24 hours.
95% of its current open positions are in the green…
With the average gain across all positions now standing at 106%.
But with liquidity spiking, this could just be the start.
So click here to secure your seat for my live strategy reveal tomorrow…
And I’ll see you Friday morning at 11 a.m. ET sharp.
P.S. If you’re planning to attend on a mobile device, make sure you download the presentation app now so you don’t miss anything when it starts. See you there.
iOS: https://apps.apple.com/us/app/goto/id1465614785
Android: https://play.google.com/store/search?q=goto&c=apps
Customer Story of the Day
“I’ve been an extremely happy customer for over a year. I’ve doubled my money and would have made more money had I not ventured off and did my own thing. (a learning experience, but much wiser now).”
Embrace the surge,
Ross Givens
Editor, Stock Surge Daily


