Today, we’re going to continue our ongoing chart pattern series with a pattern we’d all like to see take place in the broad market…
Yes, I’m talking about a bottoming pattern that could tell us when the market will finally turn back to the upside.
Of course, there are no guarantees in technical analysis or trading in general…
But with the right information, you can make a much more educated decision about which way the market might move next.
History as a Guide
Today, we’re going to cover the “Double Bottom” pattern, which is a trend reversal pattern.
But before we get to the current market, let’s look back a few years on the SPDR S&P 500 ETF Trust (SPY) for a great set of examples…
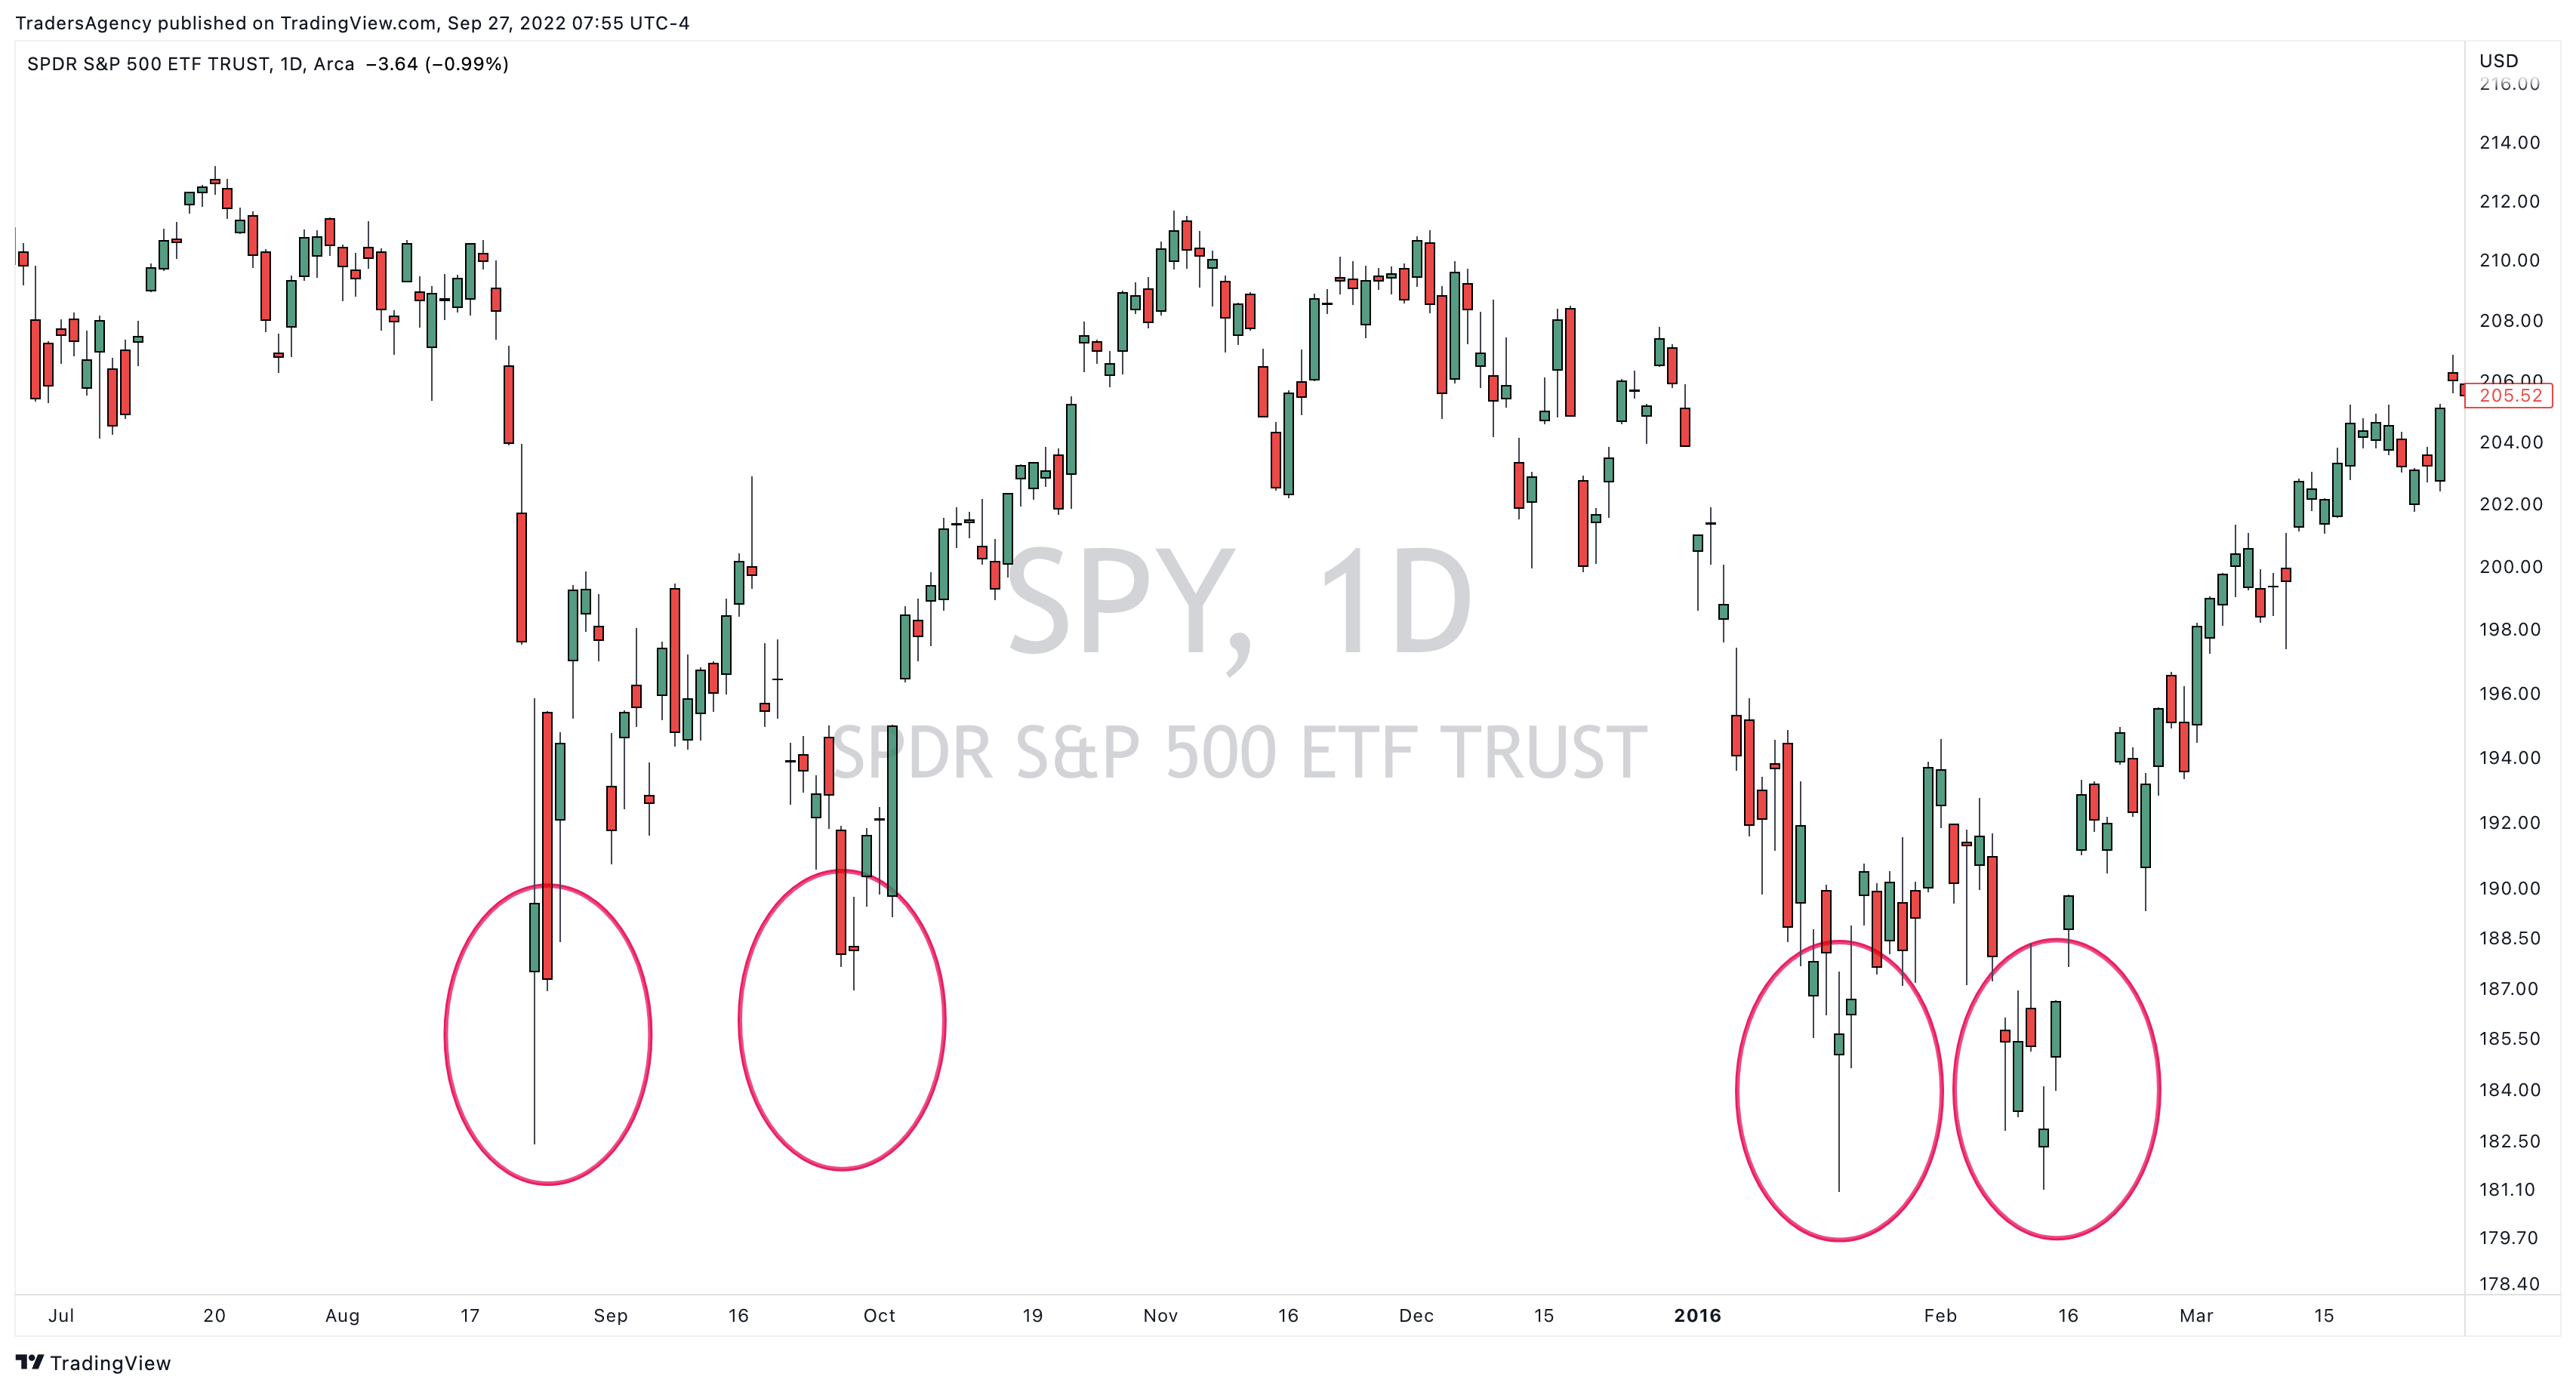
In the daily chart of SPY above, you can see the wild price action from back in 2015-2016.
The market saw two large drops during this time period, and each one resolved higher following a double bottom reversal.
As I mentioned above, the double bottom is considered a reversal pattern because it reverses the prior trend.
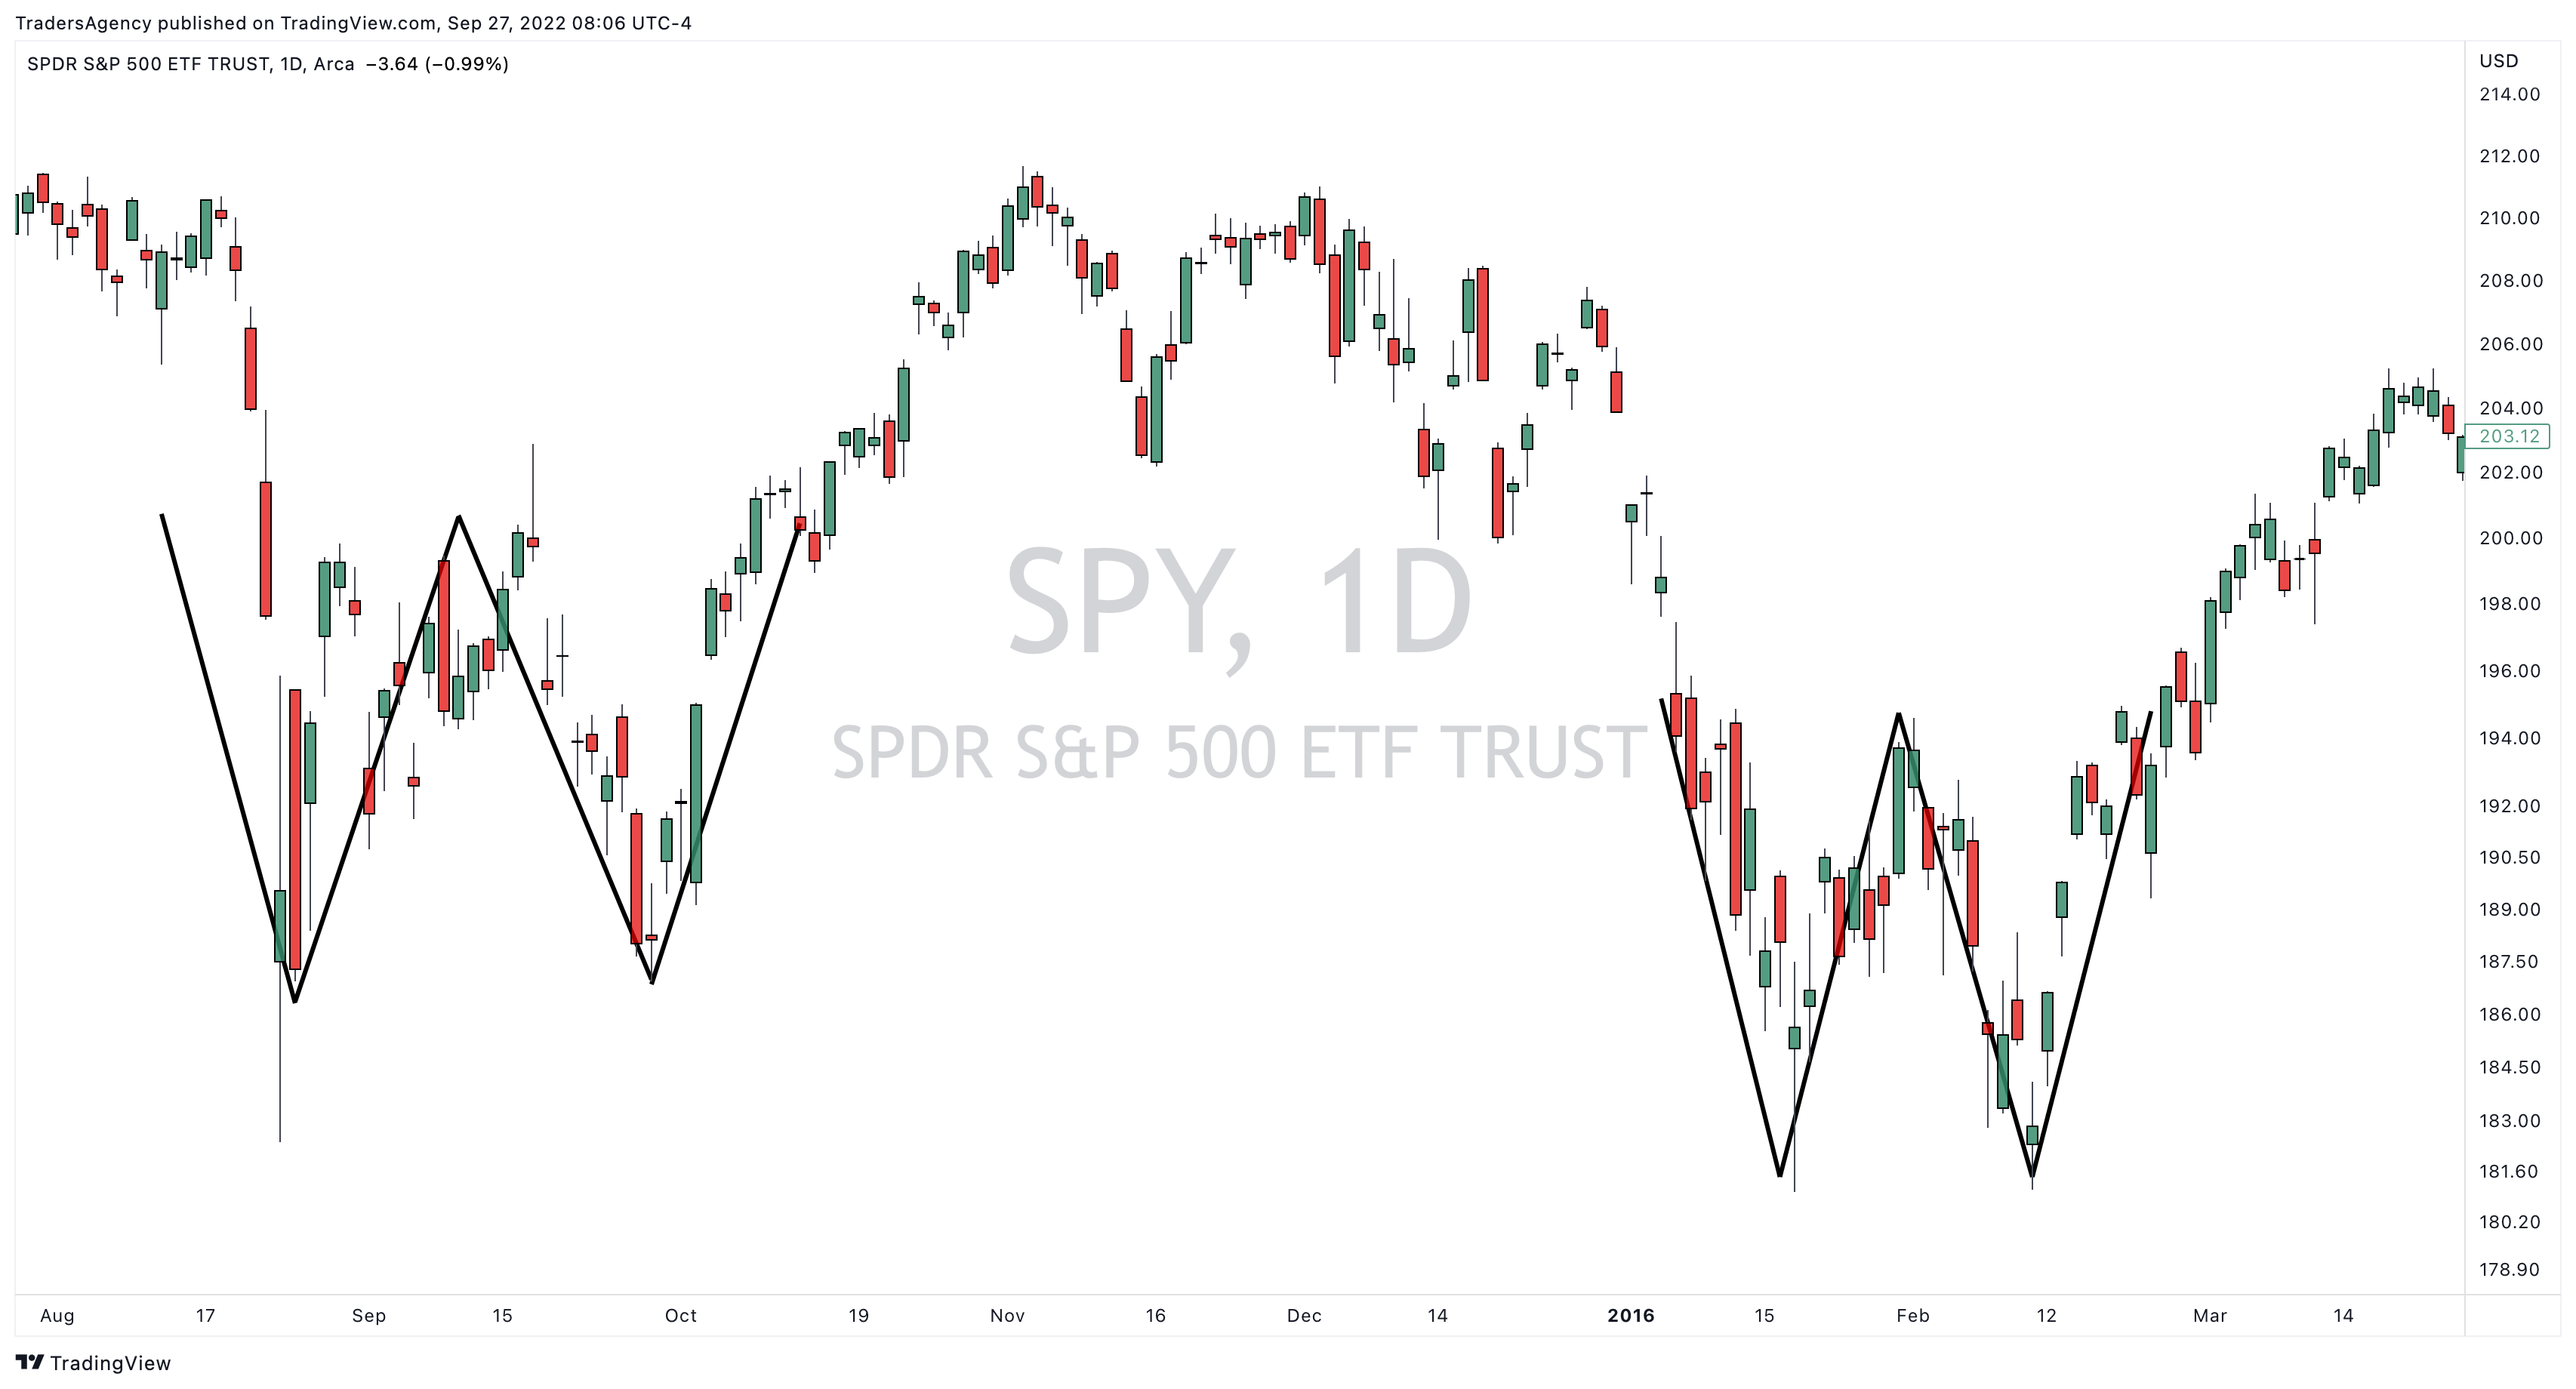
In the examples above, you can see that the market fell sharply to the first low point, bounced higher and then rolled over right back to the same level to form a second low point.
Then, once the second low was formed and price held at the support level created by the first low, it started to move higher again.
This price action is what gives the double bottom pattern its signature “W” shape…
Now, let’s fast-forward to today’s chart of the SPY…
Personally, it looks to me like the market is going to break the June lows and make another push to the downside.
However, as you can see in the daily chart below, the SPY is sitting right on the potential support level from June.
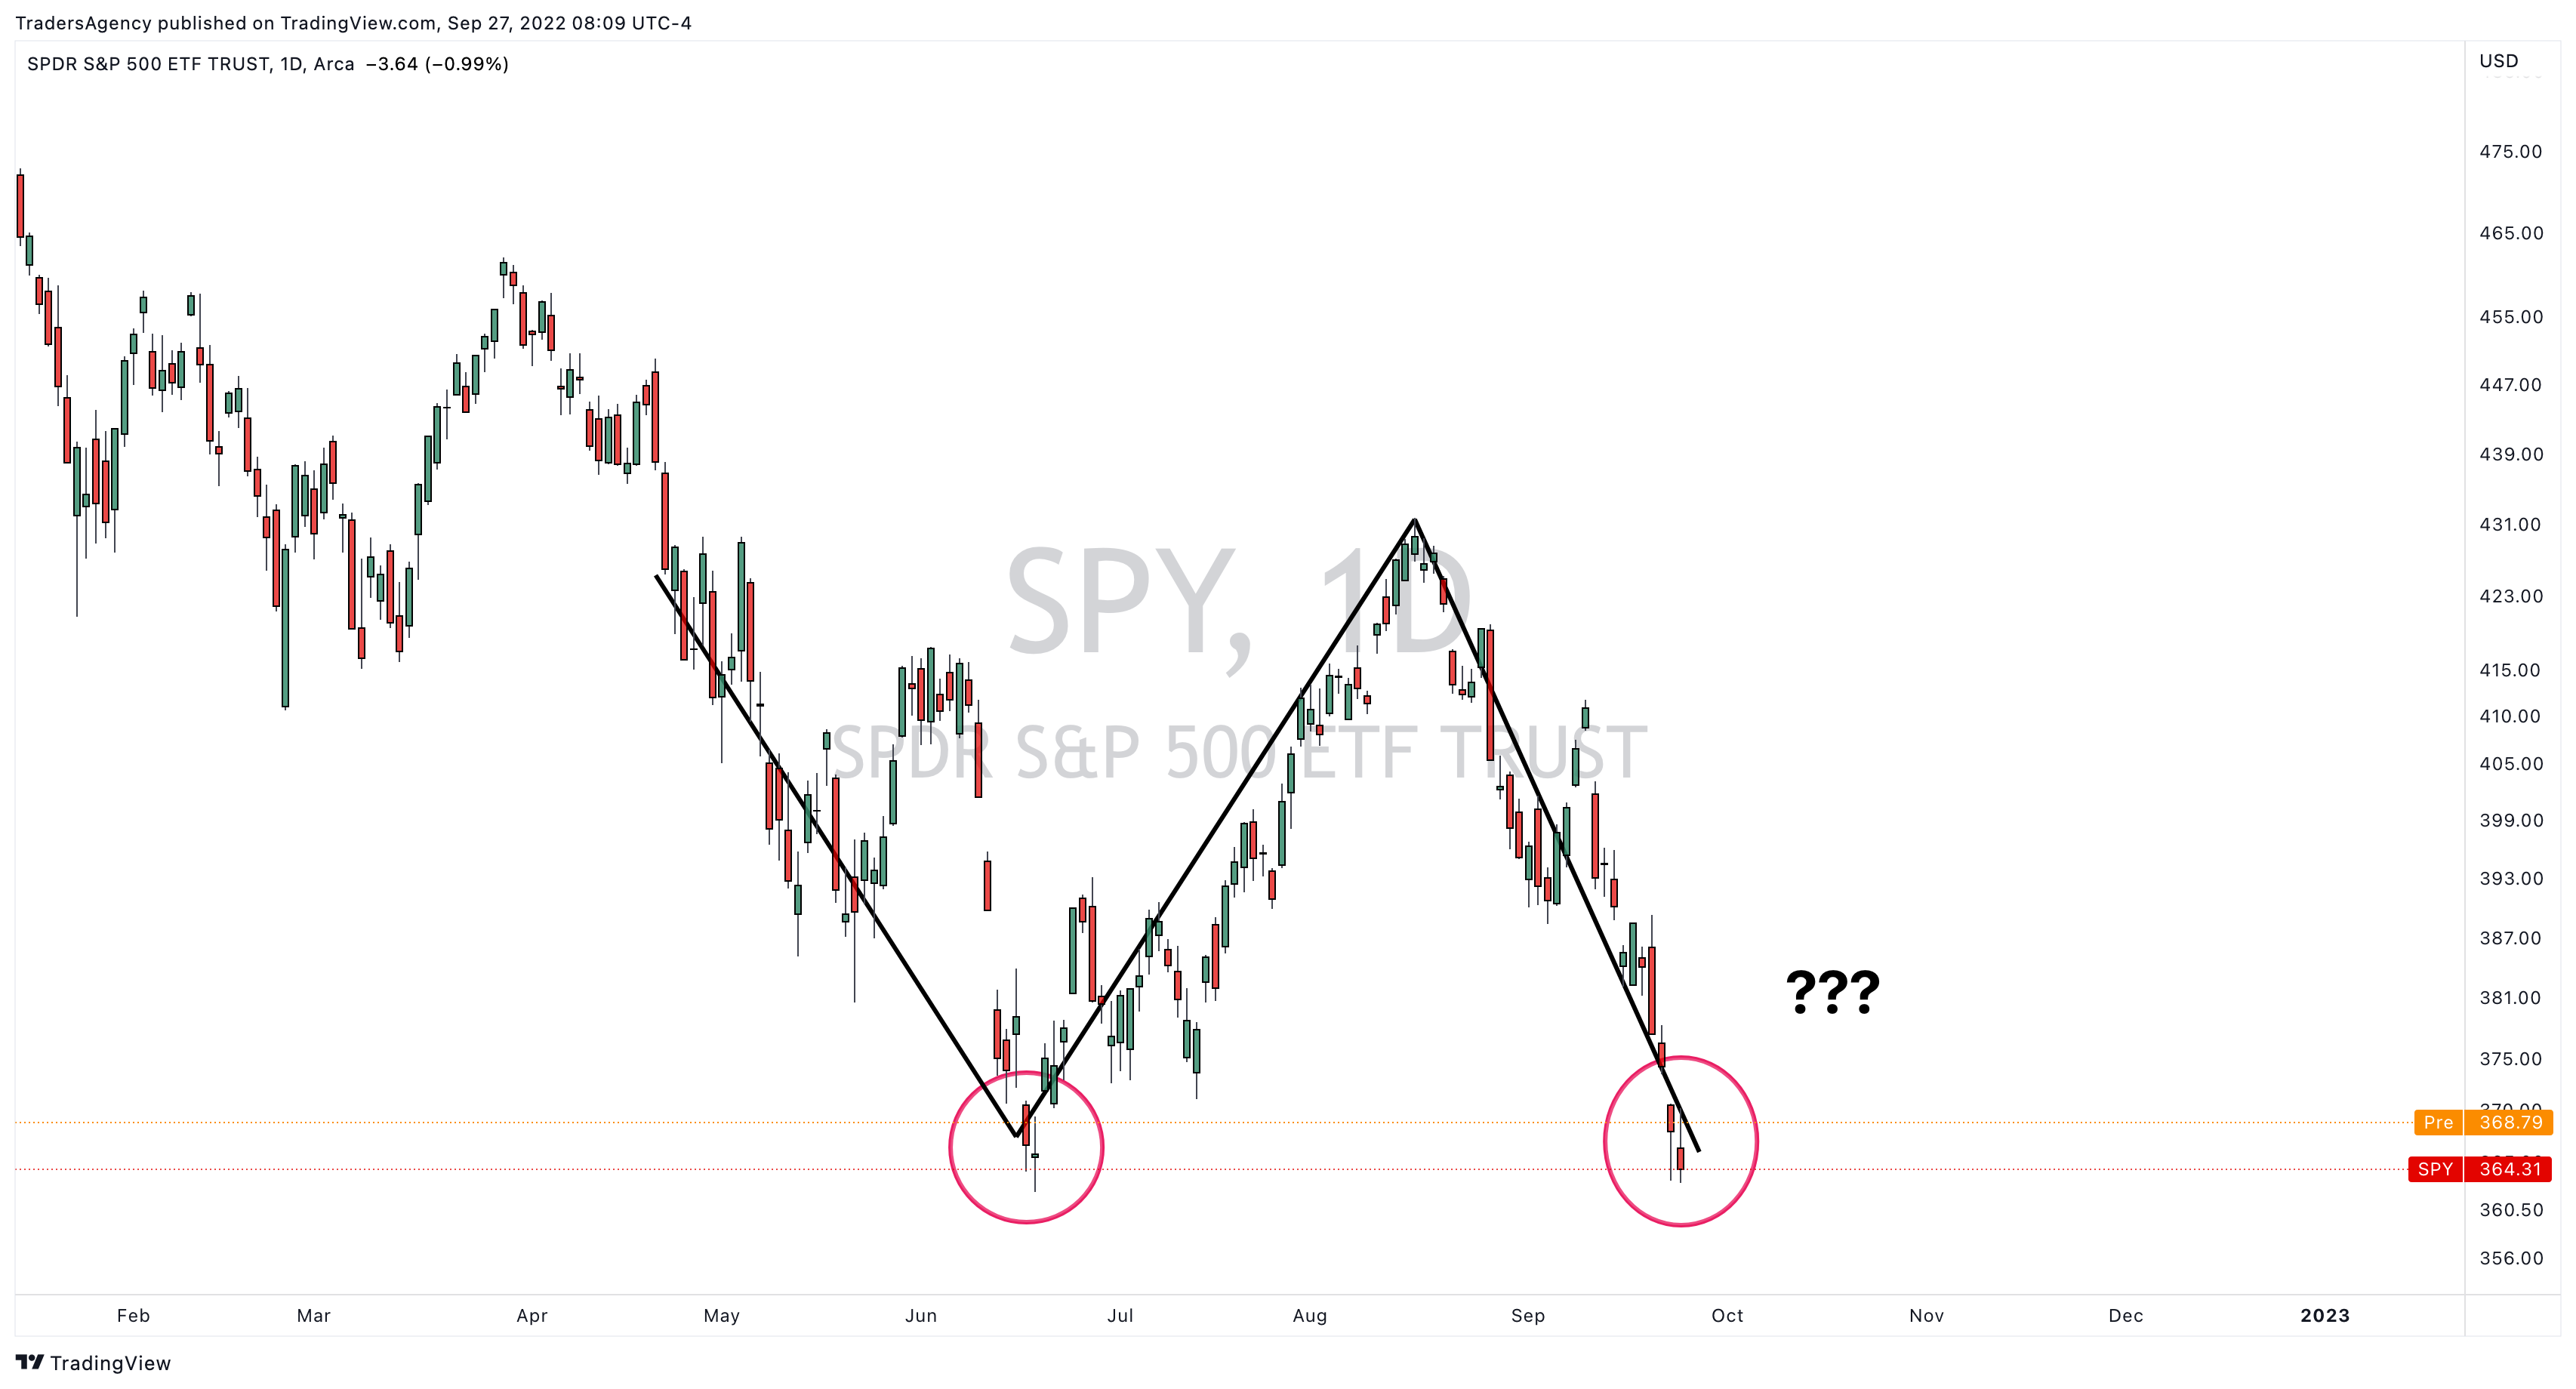
If this level holds and the market makes a second push higher, we could see another double bottom take place in SPY this year.
Of course, there is no confirmation at the moment, and there are no guarantees that this will lead to a longer-term rally in the market.
It could push higher for a few days and then collapse, or support could fail immediately.
However, I wanted to show you the similarities between 2015-2016 and the current chart to hopefully offer you a different perspective on the market.
Don’t Miss “The Apex Fortunes Summit”
Before I go, I want to remind you once more about the groundbreaking event Anthony Speciale and I are putting together TODAY, Sept. 27, at 1 p.m. ET.
You see, despite the massive amount of uncertainty and volatility that’s flooding the market…
My good friend and gifted trader Anthony Speciale is still kicking ass…
In fact, in just four months he’s personally shown 101 regular traders just like you how to grow their accounts by 382%.
That’s right… 382%!
Which is far better than the -20% the S&P has plunged to this year.
But what’s even more interesting…
Anthony says his phenomenal performance is all due to his proprietary “Apex System”…
Which is an advanced algorithm specifically designed to identify the Optimal Entry Point in ANY stock.
Now, luckily for you…
Since the current state of the market has proven to cause headaches for some traders…
Anthony has generously decided to not only give you a special breakdown of this system…
But also show you how YOU could leverage the“Apex” to turn every $5,000 into $25,000 like clockwork.
Which is why I highly suggest RSVP and secure a free spot to this event…
Because all will be revealed TODAY, Sept. 27, at 1 p.m. EST.
Again, while most traders are out there trying to cover their losses…
Anthony and his small group of traders are THRIVING because of this unique trading approach.
That’s why I guarantee you won’t want to miss it…
Especially once you see all of the SHOCKING details Anthony shares.
All you have to do is click here now to RSVP and secure your seat for “The Apex Fortunes Summit.”
If you have more questions or comments, please send them to support@tradersagency.com.
Embrace the surge,

Ross Givens
Editor, Stock Surge Daily


