Hey, Ross here:
Welcome back to a new trading week.
It’s been a wild ride in the markets these past couple months.
But finally – I believe we’re now back in buying season.
Chart of the Day
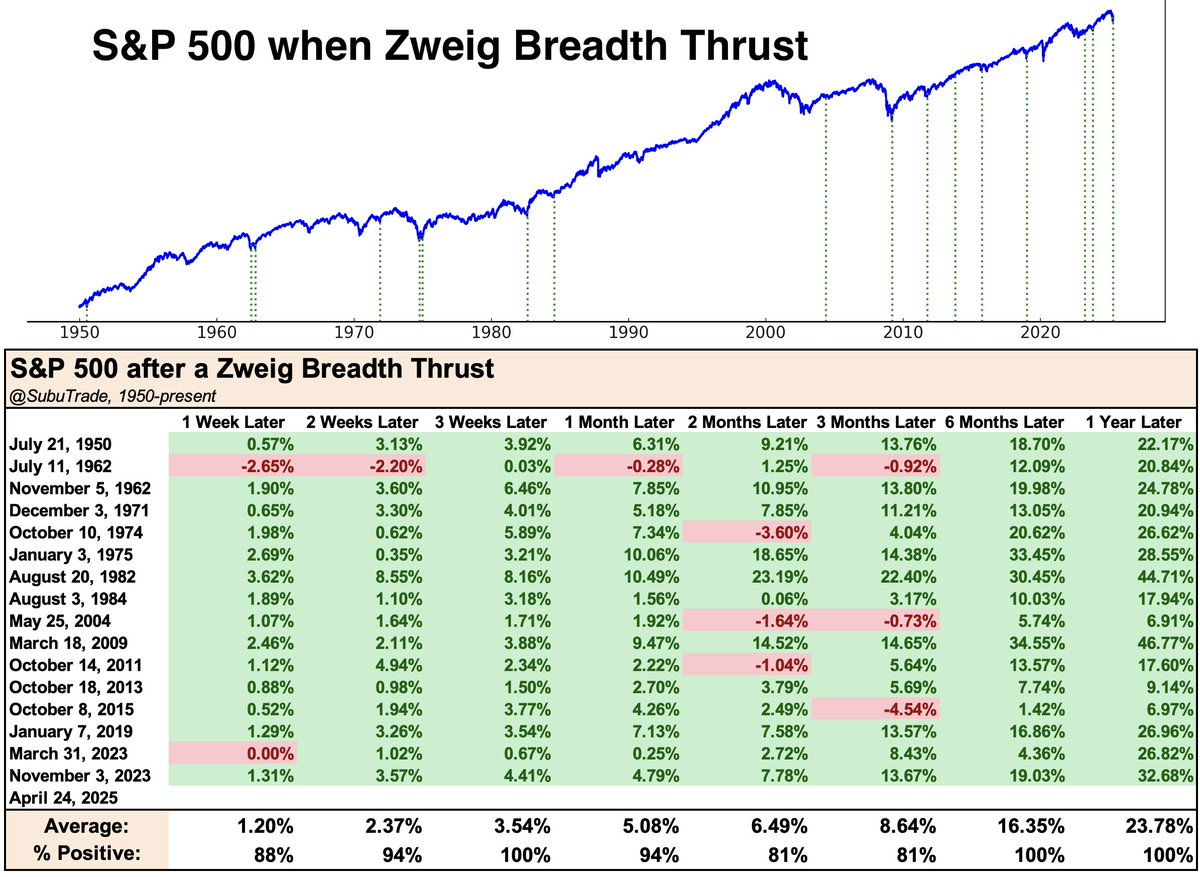
Last week, the NYSE triggered something called a Zweig Breadth Thrust – an indicator developed by American stock investor Martin Zweig.
It’s triggered when the percentage of stocks trading above their 10-day Exponential Moving Average – an indicator of very short-term direction – moves from below 40% to over 61.5% in 10 days.
Basically, it tells us that market participation – aka breadth – has staged an abrupt reversal (at least in the near term).
As the chart above shows, every time this indicator triggered, markets were reliably higher weeks and months down the line.
The last time this indicator triggered was in November 2023, which led to the strongest rally in this bull market.
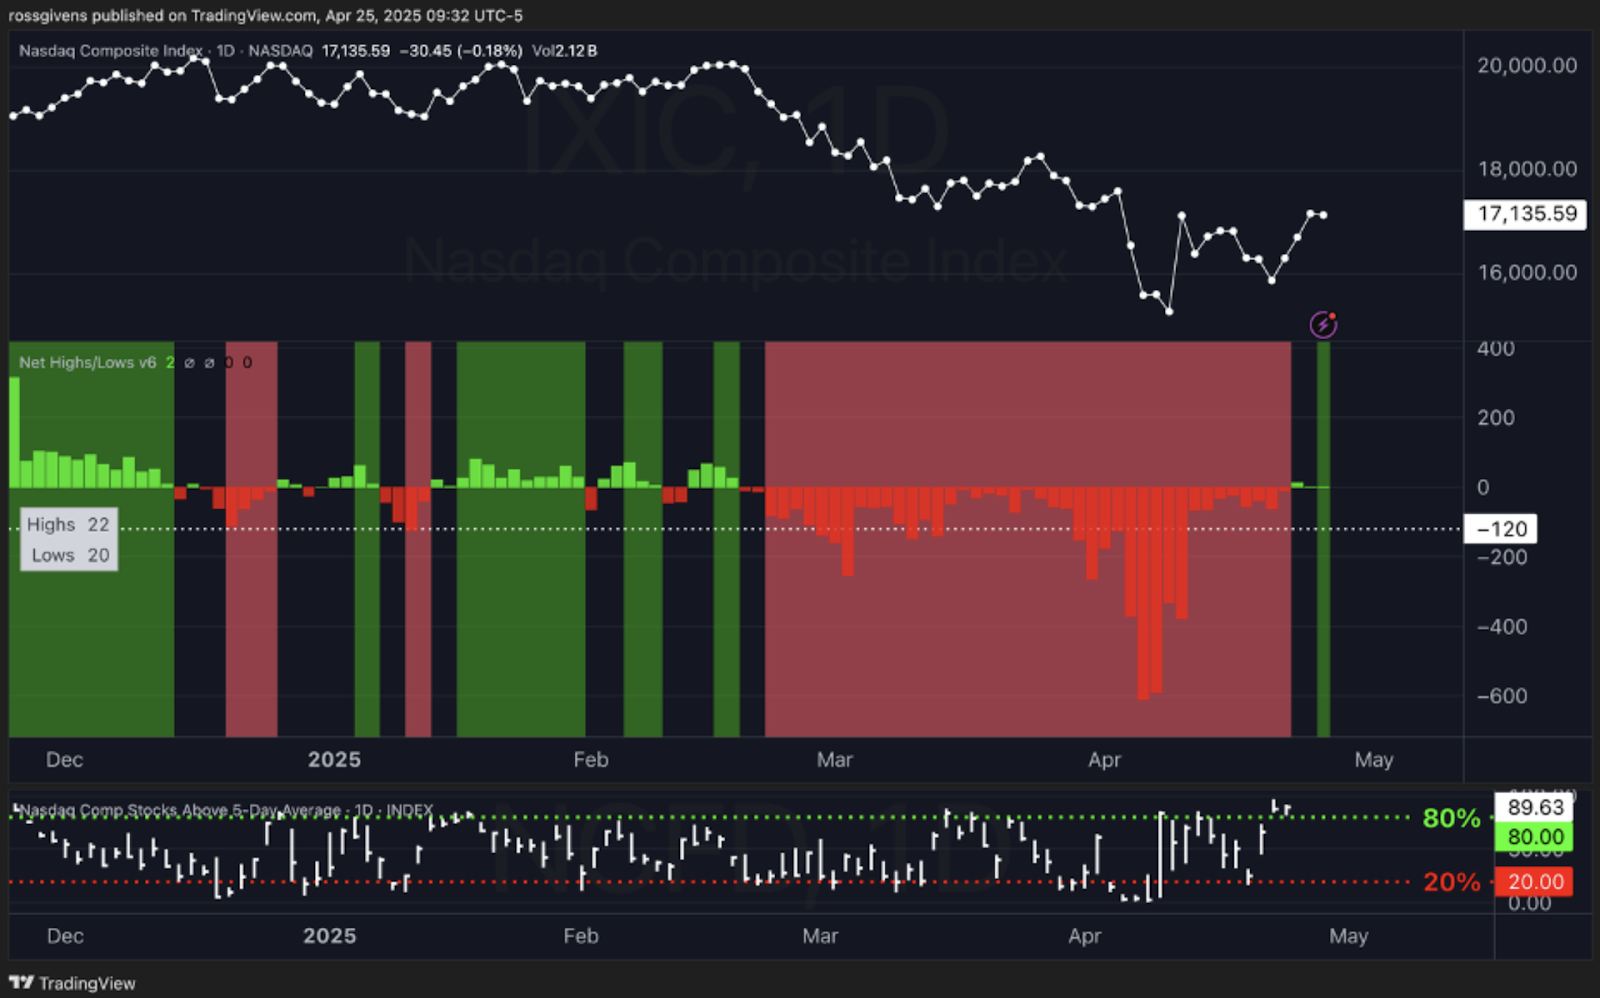
We’re also finally seeing the first glimmers of net new highs since February – another bullish signal.
As I’ve said many times before, these are all just odds not guarantees.
And with President Trump being a bit of a wild card, there’s always a chance things could flip at any moment.
But I like what I’m seeing from a breadth perspective…
And I believe we’re now back to buying season.
But what’s critical is understanding where in the buying season cycle we are.
I explain more below.
Insight of the Day
Adapt your strategy according to where we are in the market cycle.
The market is cyclical.
And that means a strategy that works in one part of the cycle may not be ideal in another part of the cycle.
For instance, we made a killing in March and April by going short.
Now, we’re in the early stages of a new buying season.
And the smartest strategy is targeting breakout stocks.
I’m not talking about the mega-cap stocks that everyone loves to report on…
But smaller under-the-radar stocks that have way more profit potential.
That’s why tomorrow, Tuesday morning at 11 a.m. Eastern…
I’m going LIVE to show you how to detect these small stocks on the verge of erupting at any moment.
The key is to look for subtle signs of buying pressure…
Because once this pressure hits a certain threshold, these stocks could explode.
I’m going to show you how to target these stocks right before that happens, by using my trademark “pressure gauge”.
This “pressure gauge” has signaled moves of 77% in 3 weeks, 87% in 24 hours, and 136% in just four weeks.
So click here to reserve your seat for my live demo tomorrow…
And I’ll see you Tuesday morning at 11 a.m. ET.
The more you delay, the more of these breakouts could pass you by.
Customer Story of the Day
“Ross sent all his members an announcement for a meeting to discuss the market and risk factors relevant for how to trade in the current uncertainty and bear trend.
He gave us risk indicators we can track on our own, discussed how to manage position size to adjust for risk, gave us solid examples and some long-term hold tips.
All as part of the service and the time was well spent.”
Embrace the surge,

Ross Givens
Editor, Stock Surge Daily