Hey, Ross here:
And let’s start the new month and trading week by looking at a chart that could signal an aggressive breakout in the markets.
Chart of the Day

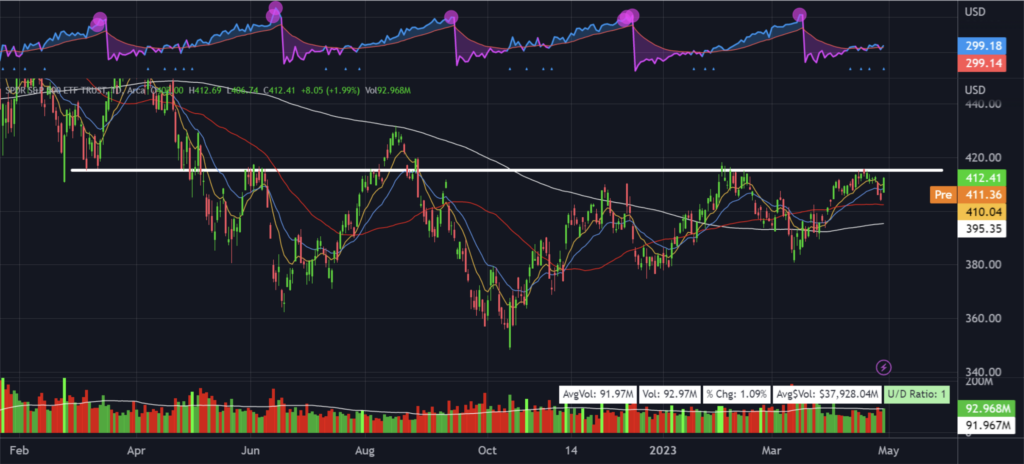
The market seems to have found previous resistance that has been tested multiple times in the past year. This area acted as a support level when the sell-off started back in March of last year and it has now run back into it multiple times.
Every time we get nearby the market seems to stall out and begin to chop sideways, not really making any significant moves.
That’s why it seems as if the market is preparing to have an aggressive break and finally hold above it.
As you can see from the chart above the 200-day moving average is now beginning to curl upwards and the deeper retracements we have created have all been higher than the previous, i.e. higher lows.
The current prediction would be a break above this level, and we can possibly see a run into the 430 area again as we did in August of last year.
At the time of writing this, we are only a few percentage points below the level, and we are right above our 50-day moving average.
P.S. Would you like special trade prospects and potential market moves sent directly to your phone? Text the word ross to 74121.
Insight of the Day
Stocks are like tools – different situations call for different types of stocks.
If you can only see stocks one way – whether it’s a long-term play, an earnings season arbitrage play, or a fast breakout play – you’ll always be limited.
To me, stocks are like tools. Different situations call for different types.
The chart above clearly shows the market making progressively shallower retracements as it bumps up against a defined resistance line.
It’s the classic “impending breakout” situation we’ve seen so many times in individual stocks.
And I believe the right “tool” for this situation is this strategy I explain here.
Embrace the surge,
Ross Givens
Editor, Stock Surge Daily


