Welcome to today’s edition of Stock Surge Daily. Here’s what I got for you.
Chart of the Day

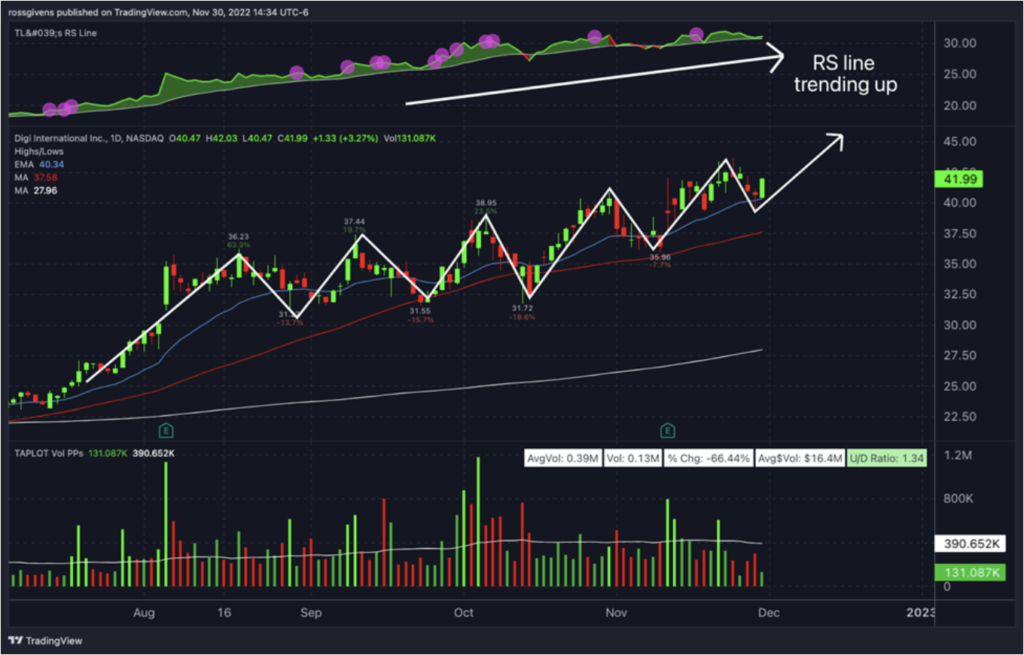
This is the chart for Digi International (DGII), an industrial Internet-of-Things company.
And it’s trending beautifully.
Check out the price action highlighted by the white arrow. Notice how the stock has made a series of higher highs and higher lows? That’s exactly what you want to see.
Plus, look how the relative strength line at the top of the chart is trending higher. This shows the stock is not only advancing – but outperforming the general market.
Volume also looks great. Notice all the tall green volume bars. These are signs of accumulation – indicative of large buying by institutional investors.
This is a stock to watch and consider buying on pullbacks.
Insight of the Day
Don’t take anything at face value – always look beneath the surface.
The S&P 500 is back up over the 4,000 mark, levels last seen in early September. And third-quarter GDP figures were recently revised upwards – breaking the negative growth pattern seen in the first two quarters.
Things are looking up, or so it seems. But beneath the surface, US manufacturing activity has stalled. For the first time since May 2020, American manufacturing is shrinking – a piece of news that’s probably already been buried under an avalanche of irrelevant information.
Is this a sign that the economy is closer to the brink than it might appear – that we might all be in for a nasty surprise next year?
It’s still too early to tell. But the lesson is clear. Never take things at face value. It’s always worth spending the extra effort to uncover what’s really going on.
This extra effort has always paid off for me. For instance, it has allowed me to spot secretive Stealth Trades happening beneath the surface – trades that have proved very lucrative. If you’re interested, click here to find out more about these trades that only a few know about.
Embrace the surge,
Ross Givens
Editor, Stock Surge Daily


