Hey, Ross here:
Let’s face it – markets have been pretty choppy these past few days.
So let’s look at what’s been going on under the surface.
Chart of the Day
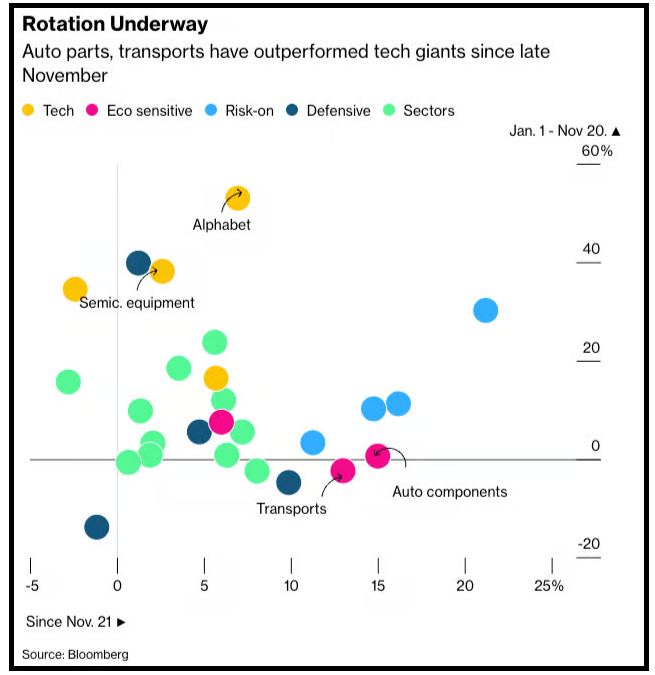
This chart shows how different market sectors have moved relative to one another over time.
Each dot represents a sector, and the arrows show where that sector was earlier – and where it is now.
The horizontal axis shows performance since the November low, while the vertical axis shows performance earlier in the year.
It can be a bit difficult to grasp the chart at first glance…
But the gist is this…
More economically sensitive areas – like auto components and transports – have been gaining strength since the November low…
Outperforming the big tech names.
This is a small snapshot of the rotation happening beneath the surface.
And all rotations bring volatility – which is what we’re likely seeing right now.
I wouldn’t be surprised if we see these choppy conditions continue for a while…
Especially with more previously-delayed economic data coming down the pipeline.
But there’s a silver lining to all this. I explain more below.
Insight of the Day
Short-term uncertainty within a strong broader picture always signals opportunity.
With the latest unemployment report showing the unemployment rate spiking to a four-year high…
There’s a lot of uncertainty about the health of the economy floating around.
Couple that with the ongoing fears of an AI bubble…
And there a lot of people unsure where the market is heading next.
And don’t forget, most of these people have absolutely no clue of the rotation I’m talking about above.
If you’ve been reading this newsletter, you already know what I think.
The data tells me that – despite the current choppy price action and the seemingly gloomy economic outlook…
We will continue to see a strong bull market for 2026.
But of course, the question is – what should you do now, as the choppy action continues?
Well, later this afternoon at 3 p.m. Eastern…
I’m going LIVE to show you the answer.
I’ll show you a powerful strategy that’s uniquely suited for taking advantage of the choppy environment.
During similar choppy markets, this strategy has found trades that have made SERIOUS runs like:
- 102% in 12 days…
- 118% in 2 days…
- 101% in 5 days…
- 207% in 5 days…
- And 519% in 60 days.
In fact, this strategy helped one of our members clear $2,000 with just two trades…
And today at 3pm Eastern, I’ll show you exactly how it works…
As well as some of the top setups it’s pointing to right now.
The session is completely free to attend…
But you do need to click here to lock in your spot if you haven’t already.
See you later.
Customer Story of the Day
“Ross Givens & Traders Agency have helped me learn & identify market patterns with analysis as to WHEN and how to properly enter and exit trades, with profit!
It’s been 6 months so far, and the education has been excellent, with the profitable trades following!”
Embrace the surge,

Ross Givens
Editor, Stock Surge Daily


