Hey, Ross here:
Welcome back to a new trading week.
Inflation came in cooler than expected.
The Fed will almost certainly cut again on Wednesday.
And Treasury Secretary Scott Bessent just said that the US had reached a “positive framework” on trade.
All of this is good news for the markets.
So let’s take a closer look at what Friday’s price action indicated.
Chart of the Day
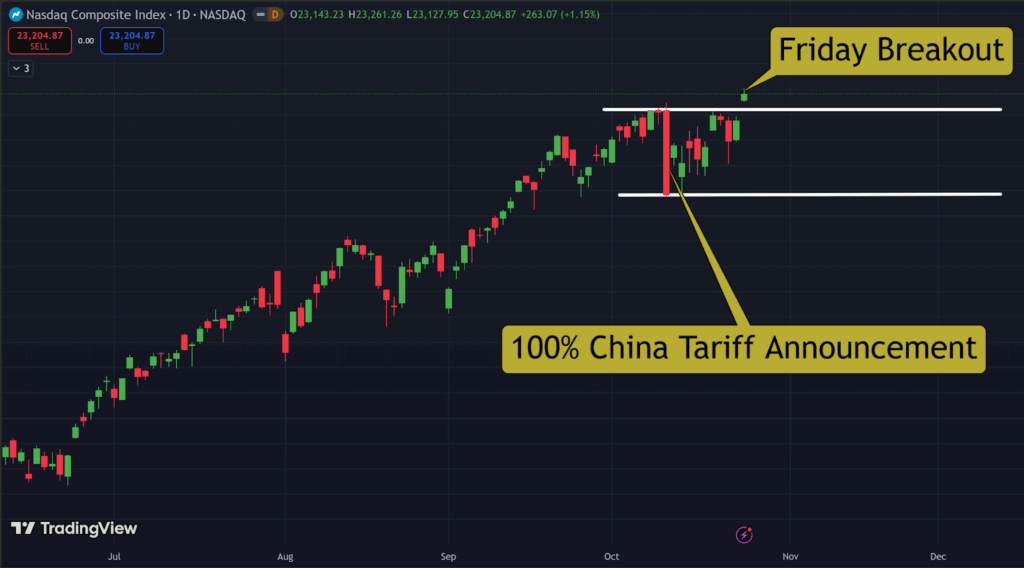
On Friday, October 10, the Nasdaq dropped 3.5% upon Trump announcing the additional 100% tariffs on China.
The Nasdaq dropped 3.5% on its worst day since April.
You can see this drop visualized in the tall red candle in the chart above.
And you will also see that, since then…
All the price action has happened within the range defined by that single day.
That means that, for nearly two weeks, buyers and sellers were locked in a tug-of-war between those two levels.
Each test of support and resistance kept reinforcing the range.
Then on Friday, after the cool inflation report, the index finally broke out past the ceiling…
Signalling that buyers had absorbed all the selling pressure from the tariff shock.
Now that all that selling pressure has been absorbed, the market is free to move higher.
Plus, as I explain in the Insight of the Day below, individual stocks still have plenty of room to run.
P.S. Tomorrow, I’m dropping my next edition of 2 Trades in 2 Minutes – 2 explosive breakout trades for taking advantage of Wednesday’s rate cut. Get on the SMS priority list by texting the word “trade” to 87858 and get those trades sent straight to your mobile the second they’re released.
Insight of the Day
Market breadth indicators point toward individual stocks having lots of breakouts left in them
Look at this chart.
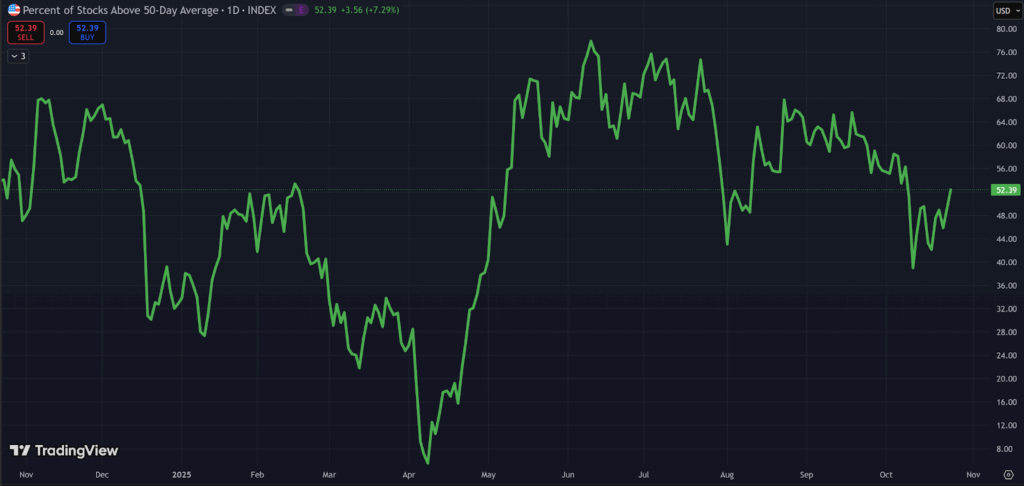
This is the percentage of stocks trading above their 50-day moving averages – a sign of medium-term direction.
Right now, about 52% of stocks are trading above their 50-day average – while the market has broken out to a new all-time high.
As you can see, during other periods this year when the market was moving up – this percentage has been well over 60%.
The bears would say this means the market breadth is weak underneath the surface.
I say it means breadth has lots of room to increase…
Which means individual stocks have plenty of breakouts left in them.
Remember, in any market, stocks don’t move at the same time.
The leaders move first and then the rest catch up.
Right now, with rate cuts looming – we’re seeing the big mega-cap tech stocks move first and pull the entire index up with them.
But the breadth readings tell me that the smaller stocks have yet to catch up.
This is great news…
Because it means we can position ourselves in the most explosive ones before they break out.
That’s why tomorrow, Tuesday October 28, at 11 a.m. Eastern…
I’m going LIVE for a special session to walk you through my #1 chart pattern for identifying these explosive setups.
Some of the greatest traders in history swear by this pattern…
And it’s served me (and our members) well for years.
Our most recent trade this pattern spotted is up 53% in just a few weeks…
All while the market has been chopping around sideways and going nowhere.
But with the Fed about to cut yet again – and breadth having so much room to run…
Gains like these could just be the start.
So click here to secure your seat for my live strategy walkthrough tomorrow…
And I’ll see you Tuesday morning at 11 a.m. ET.
Act before the Fed does.
Don’t let yourself miss out on all the explosive opportunities yet to come.
P.S. If you’re planning to attend on a mobile device, make sure you download the presentation app now so you don’t miss anything when it starts. See you there.
iOS: https://apps.apple.com/us/app/goto/id1465614785
Android: https://play.google.com/store/search?q=goto&c=apps
Customer Story of the Day
“I joined both the War Room and the Stealth trades programs a little over 6 months ago.
I honestly do have to say that I have learned more in these last 6 months about chart patterns, insider buying, how to follow the money, pullbacks, analytics, chart/price indicators, when to buy, when to sell, how to look for quality stocks and just really developing/having a much better and clearer look and understanding about the market than I have learned in the past 2 yrs of my trading career trying to learn myself or with other so called market trading mentors and that are not.
Ross Givens is genuinely a master when it comes to the market and is genuinely here to really help his students succeed, profit and learn.
AND YOU WILL!!!!.. If you watch, study, learn and show up to every amazing war room/ trader’s agency webinars/classes. Which are so incredibly beneficiary and valuable just in itself.
I started trading in my individual IRA 6 months ago with $3700 and it is worth $6900 today. I’m up $3200 profit about 187% return on my IRA from when I first started by taking and using what I’ve learned and continue to learn from within the Traders Agency.
Nothing but respect for Ross and his team at TA. They are 100000000000% the REAL DEAL and
I cannot thank them enough for the results I am seeing now with my trading. Solely due to the TA teaching strategies, webinars and all the very in-depth knowledge Ross and his team has to offer. RG and TA will change your life.”

Ross Givens
Editor, Stock Surge Daily


