It’s been a while since we’ve talked about price patterns…
But given that one of this week’s Watchlist stocks is forming a “cup and handle” pattern, I wanted to take some time to review that pattern specifically.
The cup and handle, sometimes called a “cup with handle,” is a well known but little understood price pattern.
It got its name because it looks something like a coffee cup, with a U-shaped base and a downward trending consolidation range that looks like a handle.
These are bullish patterns that usually take shape over weeks or months, and the breakouts can be spectacular.
However, there are certain rules traders must follow for entering trades on cup and handle patterns.
So, if you’re ready to see how I identify and trade these patterns, continue reading below…
Identify the Cup
Now, to properly identify a cup and handle pattern, the first thing to do is to look for a nice, big base that will be the “cup.”
You’ve heard me talk about bases before and how they can lead to big breakouts, and it’s no different here.
In the daily chart of Howmet Aerospace Inc. (HWM), which is one of the stocks on our Watchlist this week, you can see that a large base, or “cup,” has formed over the past year or so.
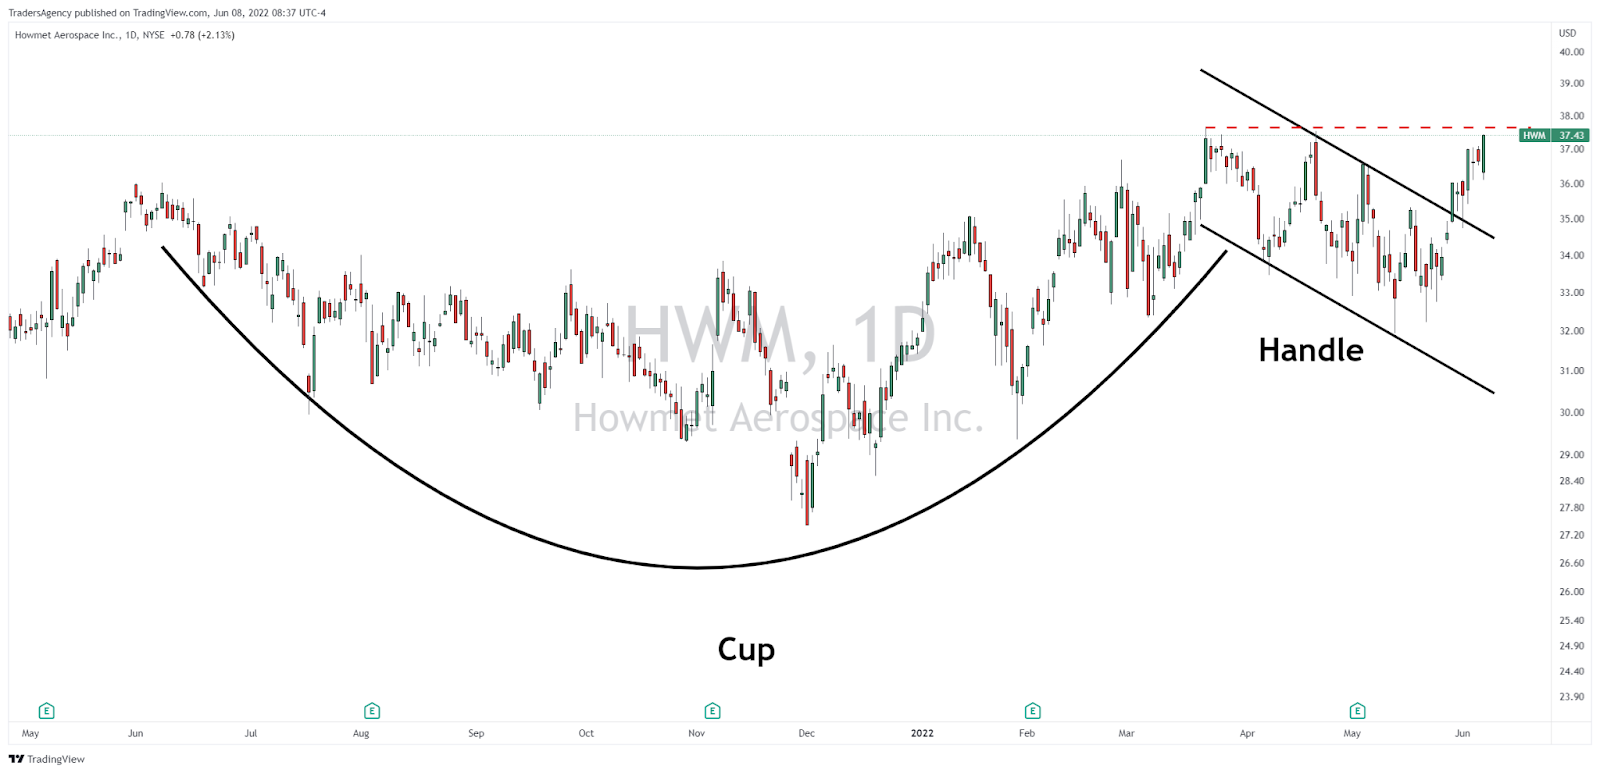
As you can see, HWM was in a downtrend for about six months, bottomed in December 2021 and then rose back to its previous highs, forming the cup.
These cups can be deep or shallow, but I find that the bigger they are, the bigger the eventual breakout.
Trade the Handle
Now, finding the handle can be a little tricky, as they can take on different shapes sometimes.
In the chart above, I’ve drawn the handle to look more like a bullish flag, or a short-term down channel.
This is often how you’ll see the handle drawn, and some traders may choose to enter the trade when the upper resistance line of the handle is broken.
However, while that’s already happened in the HWM example, this stock also has a horizontal resistance boundary overhead at around $37.50, which I’ve identified with a dashed red line.
Here’s a better view…
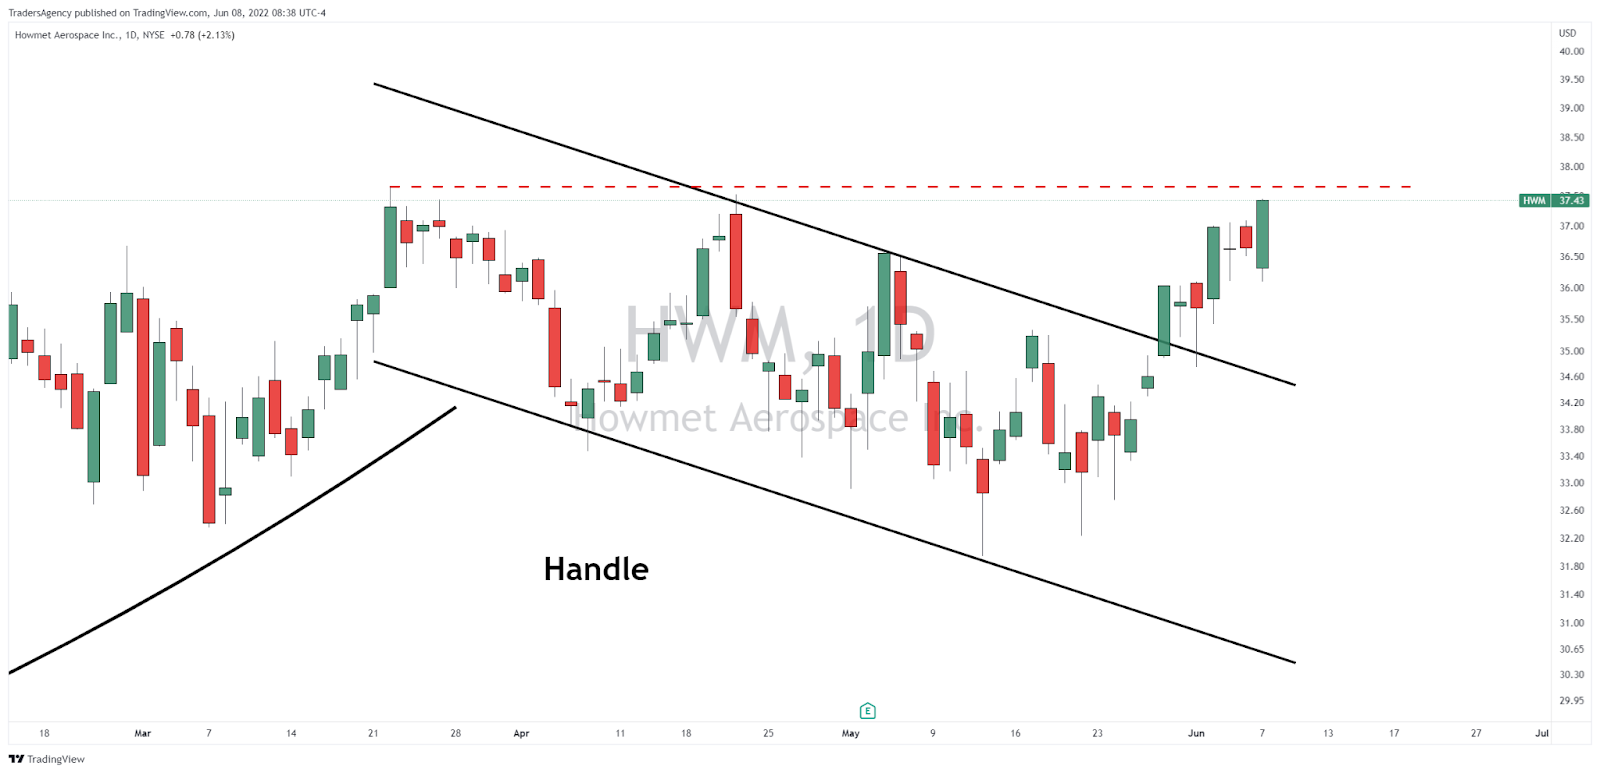
For me, I prefer to see the stock break above the high of the handle (marked by the dashed red line) before getting involved.
Specifically for HWM, that’s why I recommended looking for a strong move through $37.50 to signal a buy.
Cheating the System
But really aggressive traders often want to “cheat.” They want a way to get in early for even bigger gains.
To do this, they will look to find a tight consolidation area in the lower half of the cup, which is just a typical compression pattern as price gets tighter from left to right.
Think of it as a smaller price pattern within a larger chart formation.
I didn’t recommend this for HWM, but when taking a cheat entry, I like to go in with half of my usual position size.
For example, if a full position size is usually 100 shares, I would only take a “cheat entry” on 50 shares.
Then, when the pattern completes and breaks above the high of the handle, I will buy the other half at the official entry point.
This way, you have a profit cushion when the stock breaks out, allowing you to finance your stop loss and create a risk-free trade.
Finance the Risk
I talked about this same idea yesterday in my article, Is Your Exit Strategy Leaving Gains on the Table?
The small profit that you accumulate on the first portion of the position can be used to “finance” the risk on the remainder of the position.
After all, while it certainly looks like HWM is on the verge of a solid breakout, not every cup and handle breakout will be as “textbook” as this one.
If a failed breakout were to happen, the gain on the first half of the trade that was entered in the lower half of the cup acts as a cushion to finance the risk on the second half of the trade.
Again, I didn’t recommend this for HWM, but keep this strategy in the back of your mind for when you discover the next cup and handle pattern out in the wild.
The World’s Most Profitable Side Job
Now, no one I know is better at using technical analysis to find investment opportunities that can deliver potentially huge gains in a down market than my colleague and expert trader Josh Martinez …
Today, I want to tell you about what he describes as possibly “the world’s most profitable side job”…
Josh is absolutely meticulous in his approach to the markets, and he has years of experience teaching his students how to manage risk.
And he recently found a digital currency move that doesn’t require a fancy account, crypto wallet, or complicated setup…
It’s a little-known loophole in your brokerage account.
Click here to get all the details on this explosive opportunity right now…
Embrace the surge,

Ross Givens
Editor, Stock Surge Daily


