Lee Enterprises, Inc.
Lee Enterprises, Inc. (LEE) is a small, $232 million publishing company that produces print and digital newspapers and provides advertising and marketing services.
Here’s how the chart is setting up:

And here’s how the stock is setting up with my Stock Surge Indicator (SSI):
- Surge score: 99/100
- % Above 52-wk low: 235%
- Sales growth: +1%
- Triple momentum: yes
LEE stock surged 119% in just 22 days and is now setting up in a high tight flag pattern.
To complete the pattern, shares must not retrace more than 20%. The buy point is new highs above $41.00.
Typically, traders use the low of the retracement zone as where to place a stop loss.
But if price continues to tighten, you could use the swing low of the final retracement.
Moody’s Corporation
Moody’s Corporation (MCO) is a major $74 billion risk assessment firm that publishes credit ratings for companies in the United States and worldwide.
Here’s how the chart is setting up:
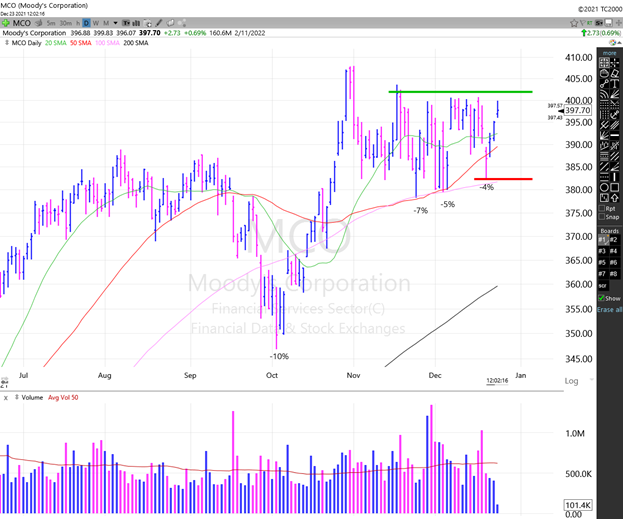
And here’s how the stock is setting up with my SSI:
- Surge score: 87/100
- % Above 52-wk low: 52%
- Sales growth: +13%
- Triple momentum: yes
Moody’s stock made a big move in the first half of 2021.
Shares have been consolidating to form a base for most of the last six months and now look primed to break out higher.
Retracements have shallowed to a nice and tight 4% range, allowing for a very low-risk entry point.
Price has not been able to get above $400.00 for a few weeks, but I would use $402.00 as a buy point.
That gives a bit of additional confirmation by trading above the highest closing price in November.
Intercontinental Exchange, Inc.
Intercontinental Exchange, Inc. (ICE) is the $76 billion operator of market exchanges, clearing houses and listings venues that some of you have likely heard of or even traded with before.
Here’s how the chart is setting up:
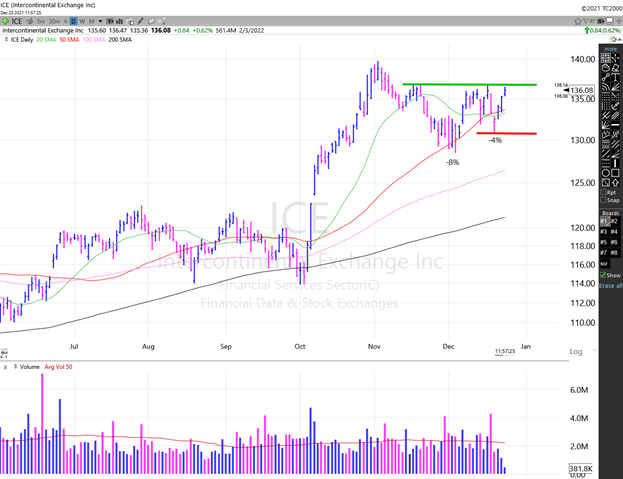
And here’s how the stock is setting up with my SSI:
- Surge score: 88/100
- % Above 52-wk low: 25%
- Sales growth: +18%
- Triple momentum: yes
I added ICE to the Watchlist last week, but shares have not yet broken through our resistance level.
Last week’s market weakness added a small 4% shakeout move, which has only made the setup look better to me.
Additionally, we can now use last week’s low as the stop, which lowers the risk on this trade.
Lastly, if you’d like a step-by-step walkthrough on how to best take advantage of these weekly trades…
Be sure to check out my recent article, How to Follow My Weekly Trades, to know where I’m buying so that you can follow along.


