Hey, Ross here:
Yesterday, I showed you what happens when a big investor gets trapped.
Leopold Aschenbrenner had the correct AI thesis.
But he was also leveraged to the hilt.
So when the trade turned against him, he was forced out.
Retail traders have been caught in the same kind of squeeze, dumping tech at the fastest pace on record.
But that raises a new question:
How many forced sellers are still left?
Because once the trapped money has finished selling…
The setup changes fast.
Chart of the Day
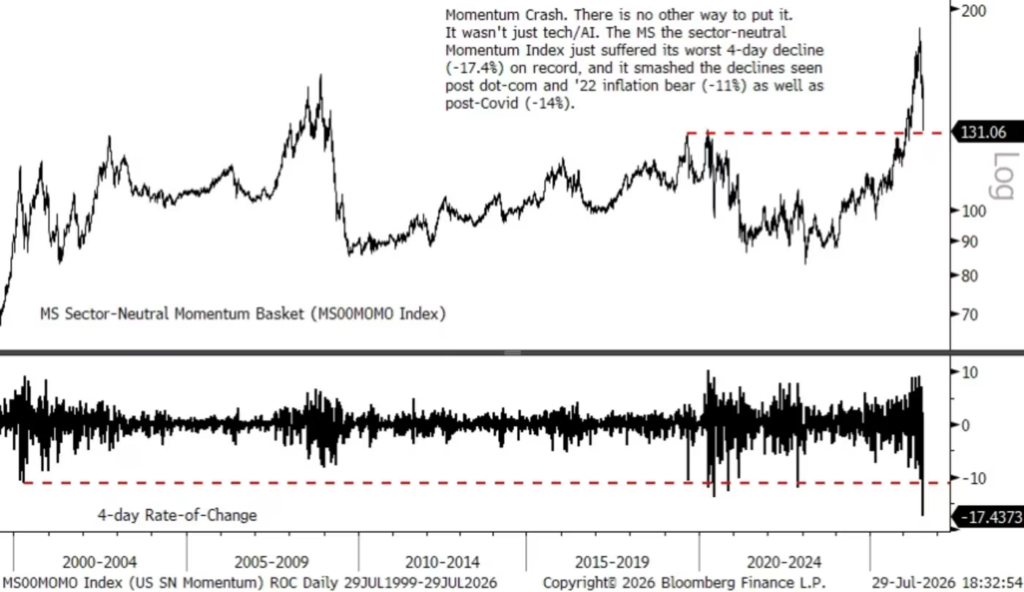
This chart tracks the market’s momentum stocks – the names that had been leading the charge higher.
Over the four-day stretch from Friday July 24 to last Wednesday July 29, that basket collapsed 17.4%.
That is the worst four-day decline on record.
Worse than the dot-com crash. Worse than 2022.
And this was not just an AI or semiconductor problem.
The basket is sector-neutral.
So the unwind ripped through ALL momentum stocks across the market.
That is what happens when too many funds crowd into the same trade…
Then all try to get smaller at once.
But now look at this:
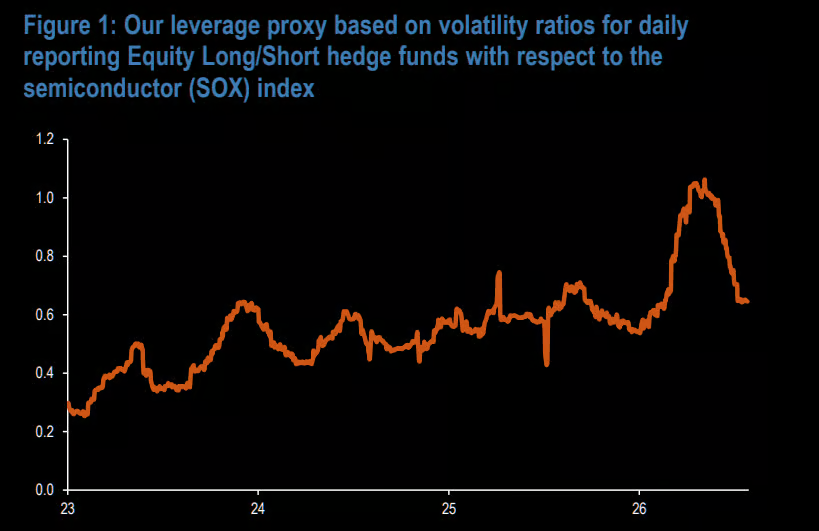
Hedge-fund leverage surged during the April and May semiconductor rally.
Then it collapsed.
JPMorgan says equity long/short funds have now unwound most of the leverage they built during that run.
And the same thing has happened inside leveraged ETFs.
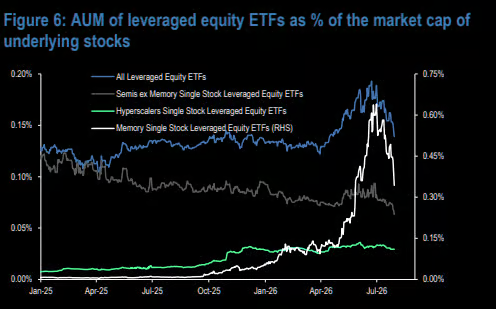
Roughly 85% of the April–May buildup has reportedly been cleared out.
So yes, the washout was brutal.
But much of the borrowed money that made it so violent may already be gone.
Yesterday, the opportunity was knowing who had to sell.
Now it may be knowing where the selling has finally run its course.
I explain below.
Insight of the Day
When weak hands are gone, strong hands move in
When a leveraged fund gets hit, it does not sell because the price is fair.
It sells because the broker wants its money back.
The fund cuts risk. The ETF rebalances.
The weak hands get flushed out.
Price becomes almost irrelevant.
But that pressure cannot last forever.
Once the leverage is gone, those sellers are gone too.
And the stock no longer needs a tidal wave of buying to move higher.
It just needs more demand than supply.
That is when I start watching for signs that big buyers are stepping in.
Which stocks stop falling first?
Which ones hold while the rest of the group gets hammered?
Where does volume suddenly come rushing back?
Those are the big money footprints I want to see.
Yesterday’s lesson was simple:
Find out who has to sell.
Today’s is just as important:
Watch what happens when they are finished.
Because when the big money steps in again – that’s where the opportunity is.
The forced sellers are out – but the opportunity is in.
That’s why in just a few hours at 11 a.m. Eastern today…
I’m going LIVE to show you exactly how I track those big-money footprints into the explosive setups…
Using a strategy that has helped us find moves of:
155% in 150 days…
212% in 165 days…
424% in less than six months…
And even 524% in 13 months.
The forced sellers have already done a lot of damage.
Now I want to know where the buyers are taking control.
Click here to guarantee your free spot if you haven’t yet…
And I’ll see you at the live briefing at 11 a.m. ET sharp.
P.S. If you’re planning to attend on a mobile device, make sure you download the presentation app now so you don’t miss anything when it starts. See you there.
iOS: https://apps.apple.com/us/app/goto/id1465614785
Android: https://play.google.com/store/search?q=goto&c=apps
Customer Story of the Day
“I’ve been an extremely happy customer for over a year. I’ve doubled my money and would have made more money had I not ventured off and did my own thing. (a learning experience, but much wiser now).”

Ross Givens
Editor, Stock Surge Daily