During the depths of the pandemic, the Federal Reserve cut interest rates to zero to help save the economy.
The market went into a buying frenzy, and many stocks doubled, tripled or more from the 2020 bottom to the recent highs.
Two years later, the Fed is ramping up interest rates and will possibly send the economy into recession to battle inflation.
Interest rates plunged at first but are now spiking again, so it makes sense that the stocks that spiked during the pandemic rally are now plunging again.
Most of these stocks have already made a full round trip and have gone nowhere over the last two years.
However, I am very interested to see if they might start to turn around at their pre-pandemic highs and what that might mean for the broader market.
Here are 10 stock charts I’m watching that are back or nearly back to where they were just before the pandemic hit…
NIKE, Inc.
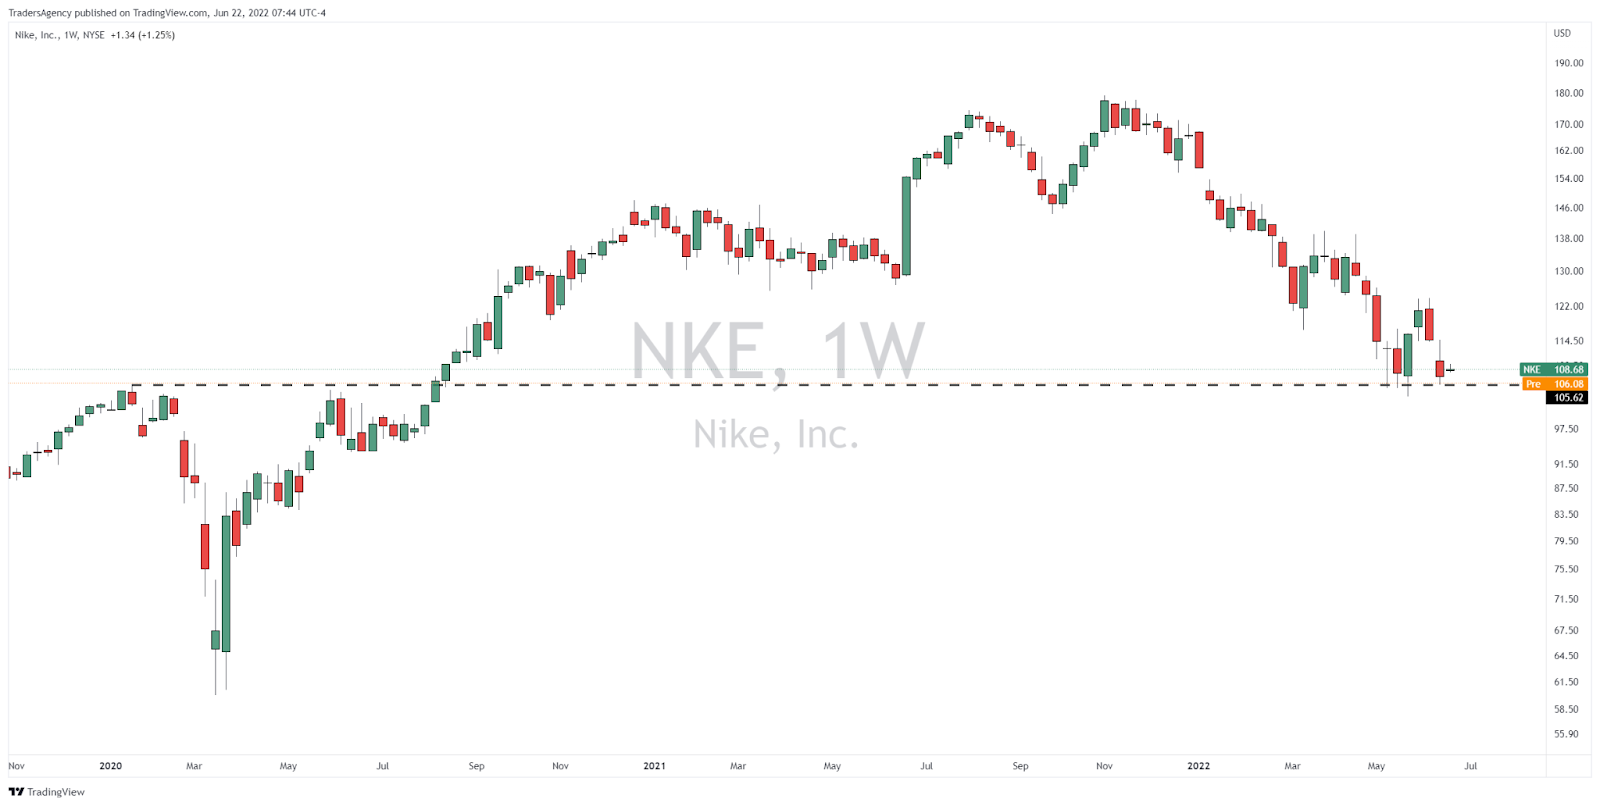
Nike (NKE) rallied 199% from the 2020 bottom to the 2021 top but has now dropped around 40% back to its original breakout point.
McDonald’s Corporation
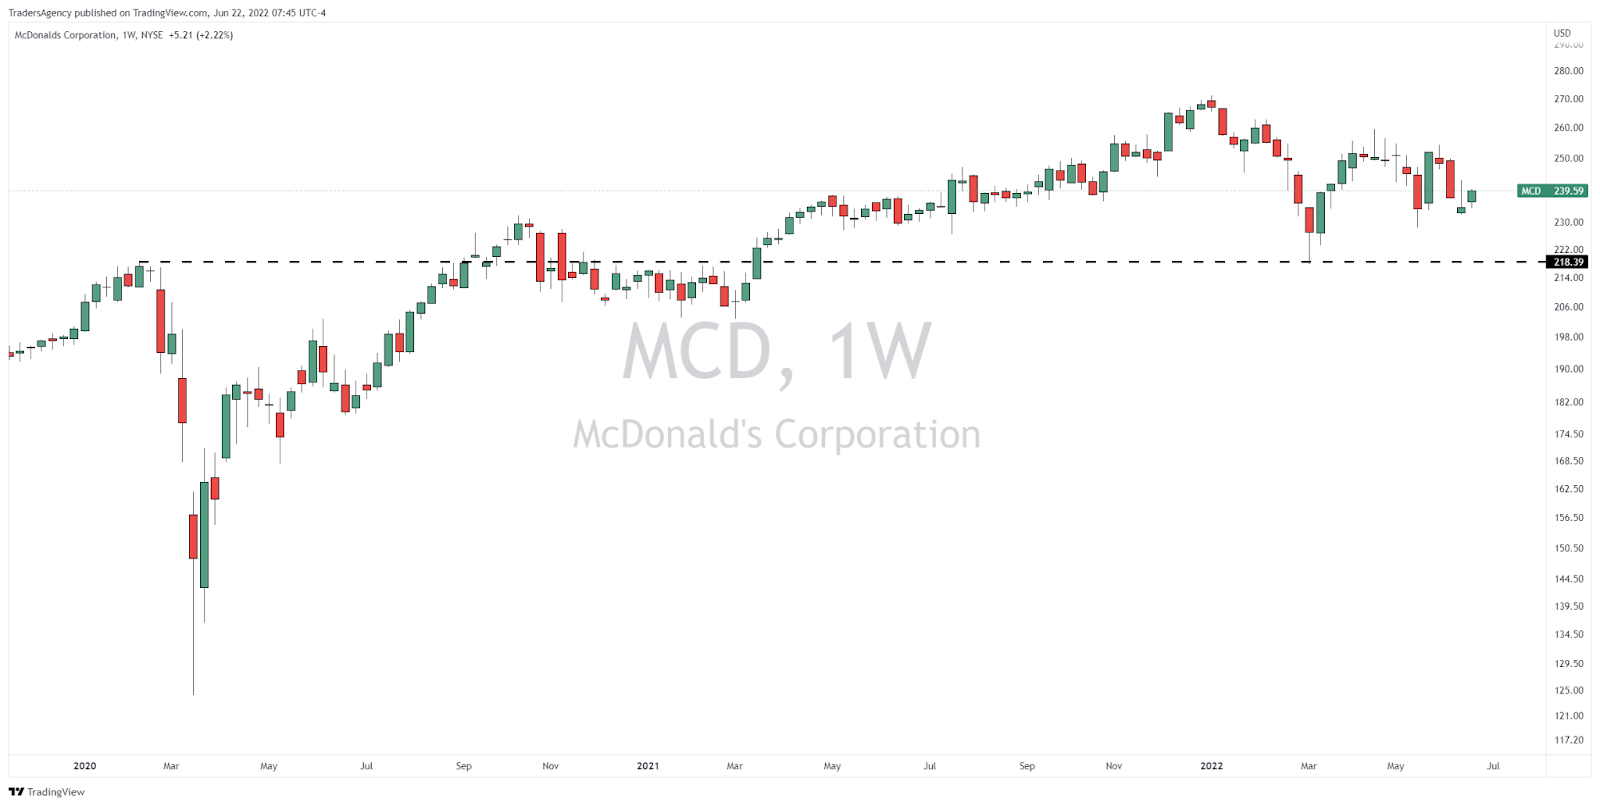
McDonald’s (MCD) saw a 118% gain from trough to peak. The stock fell 20% in the first quarter but has now started to stabilize and move higher again.
The Home Depot, Inc.
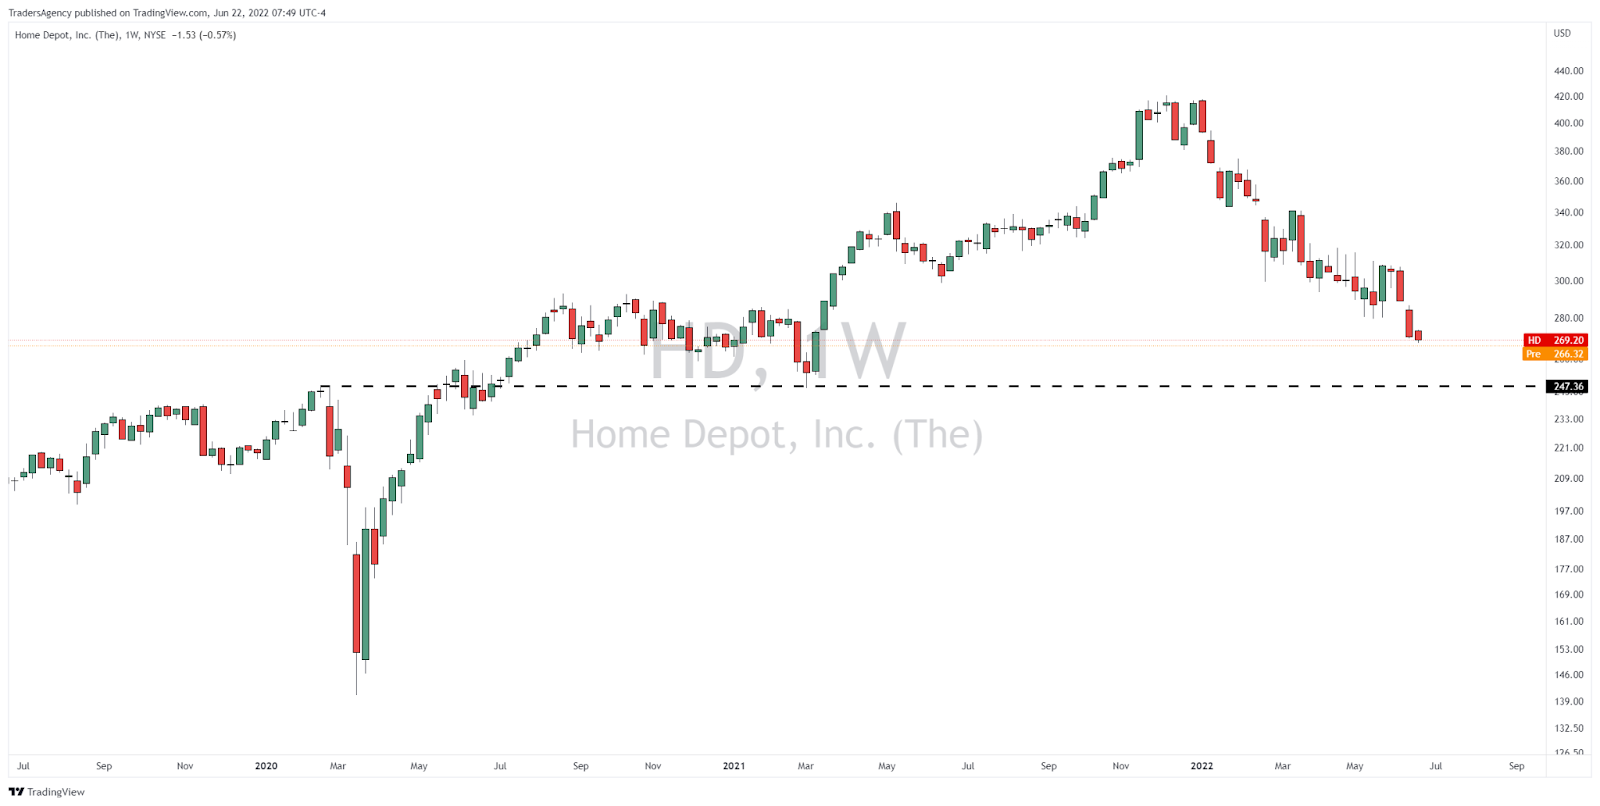
The Home Depot (HD) saw a very nice rally of 199% following the bottom as everyone wanted to get to work on their homes during the lockdowns.
The stock has since dropped 36% and is now coming up on potential support at its pre-pandemic highs.
Mondelez International, Inc.
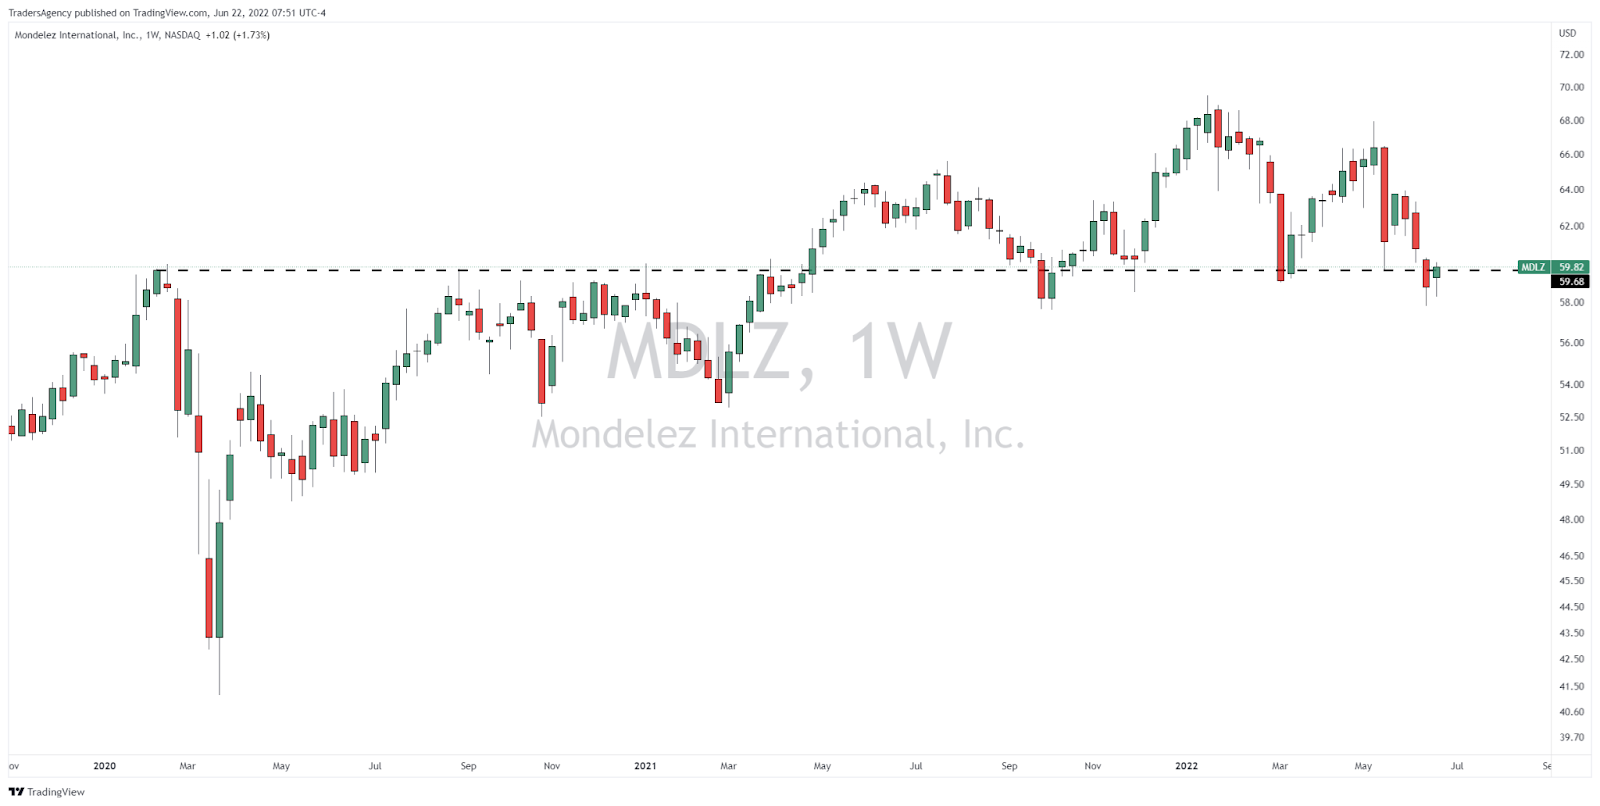
Mondelez International, Inc. (MDLZ) jumped a more moderate 69% during its latest rally but has given up about 16% this year and is currently testing its pre-pandemic highs.
Trex Company, Inc.
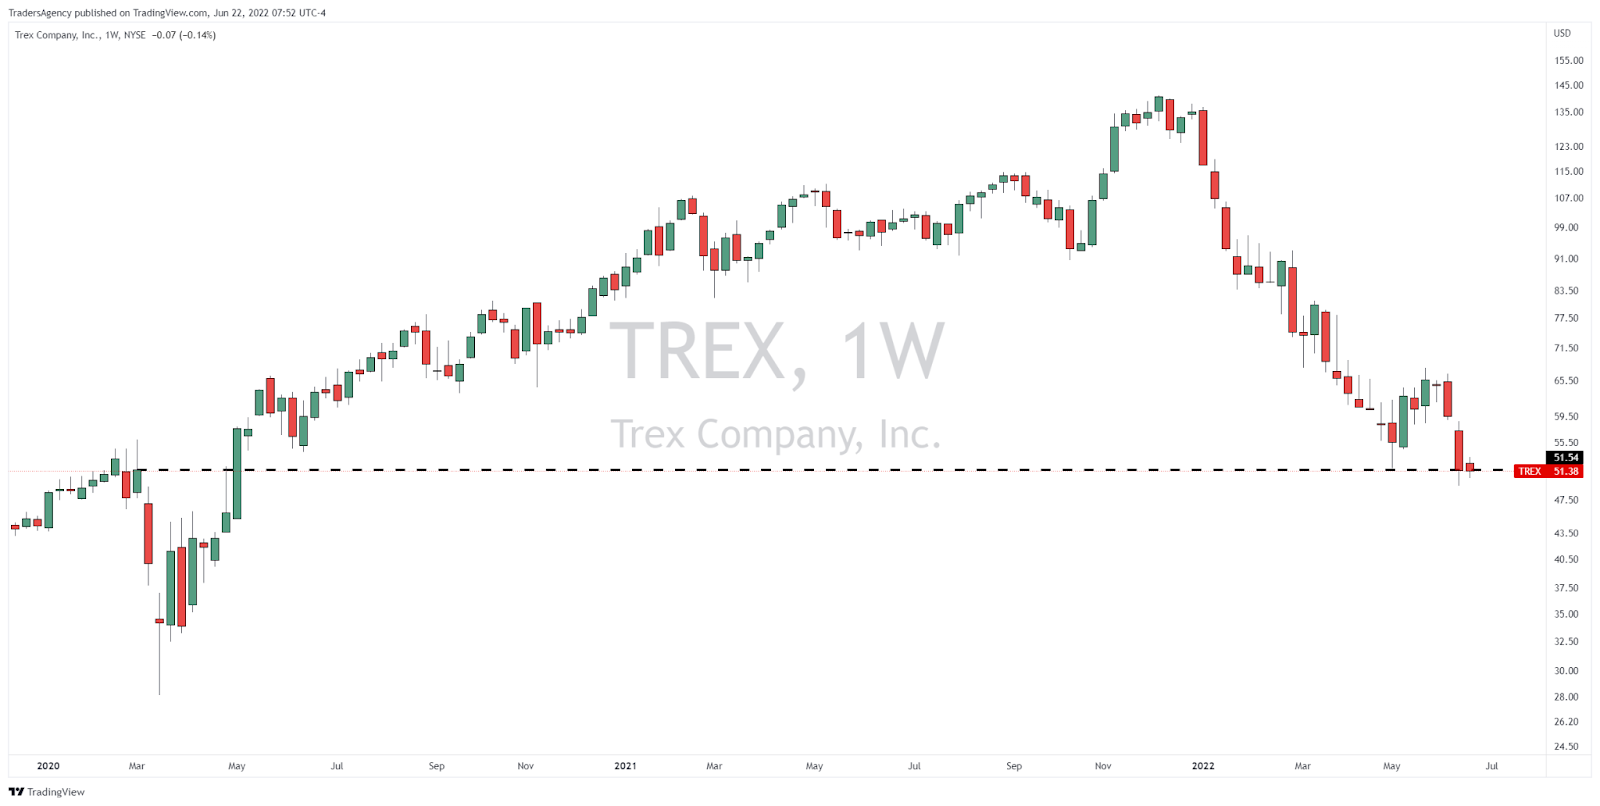
Trex Company (TREX) was a big winner during the pandemic, gaining just over 400% into late 2021. But it’s crashed 60% this year… Right back to where it broke out.
Amazon.com, Inc.
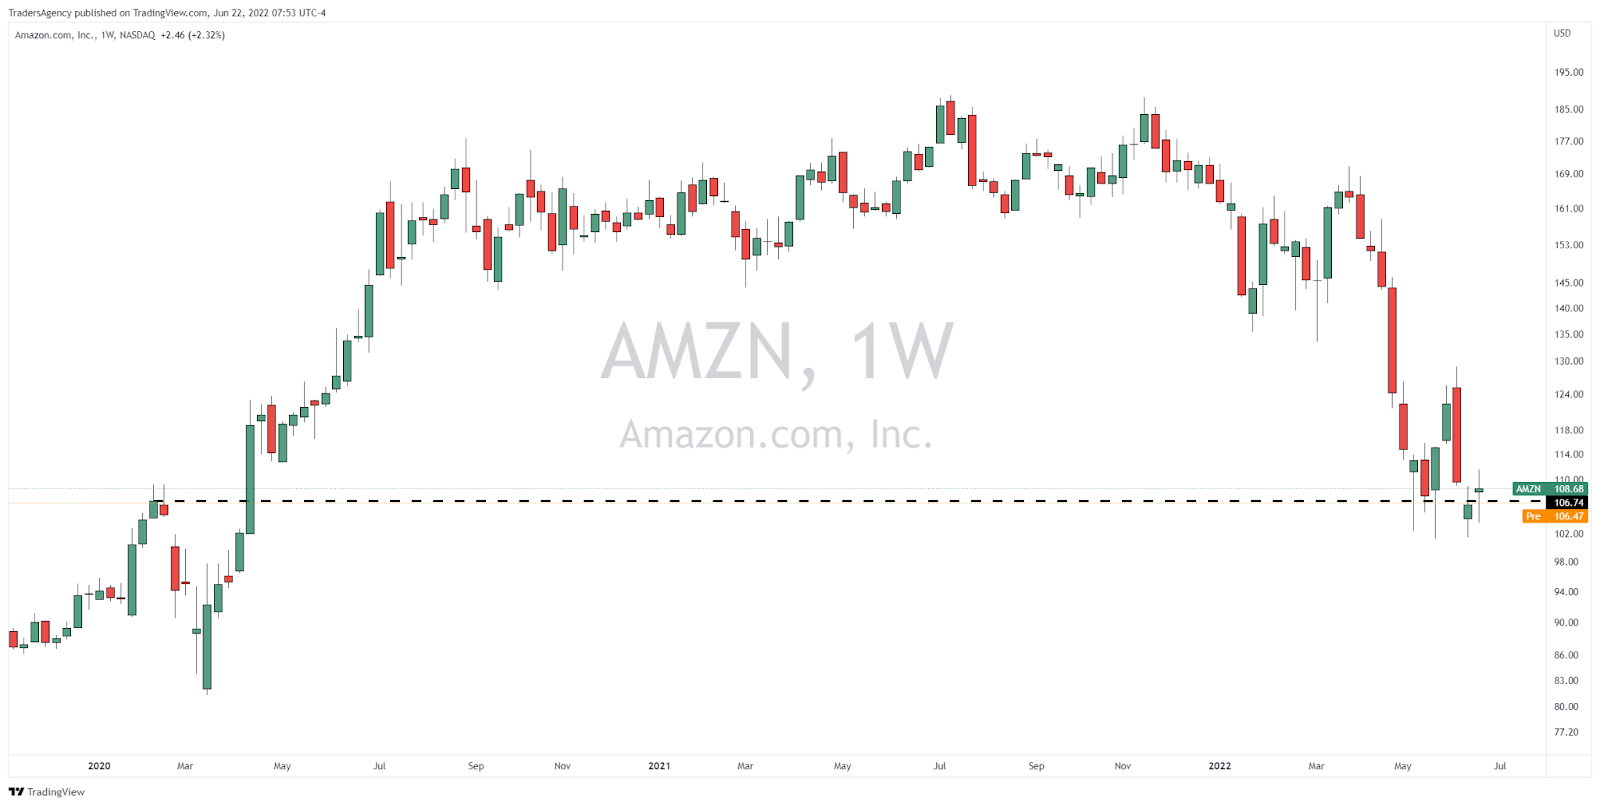
While everyone was stuck at home, we logged on to Amazon.com (AMZN) for all of our wants and needs.
The stock rallied about 132% from the bottom to the July 2021 peak but has since retraced nearly all of that move and is back to the pre-pandemic highs.
The Procter & Gamble Company
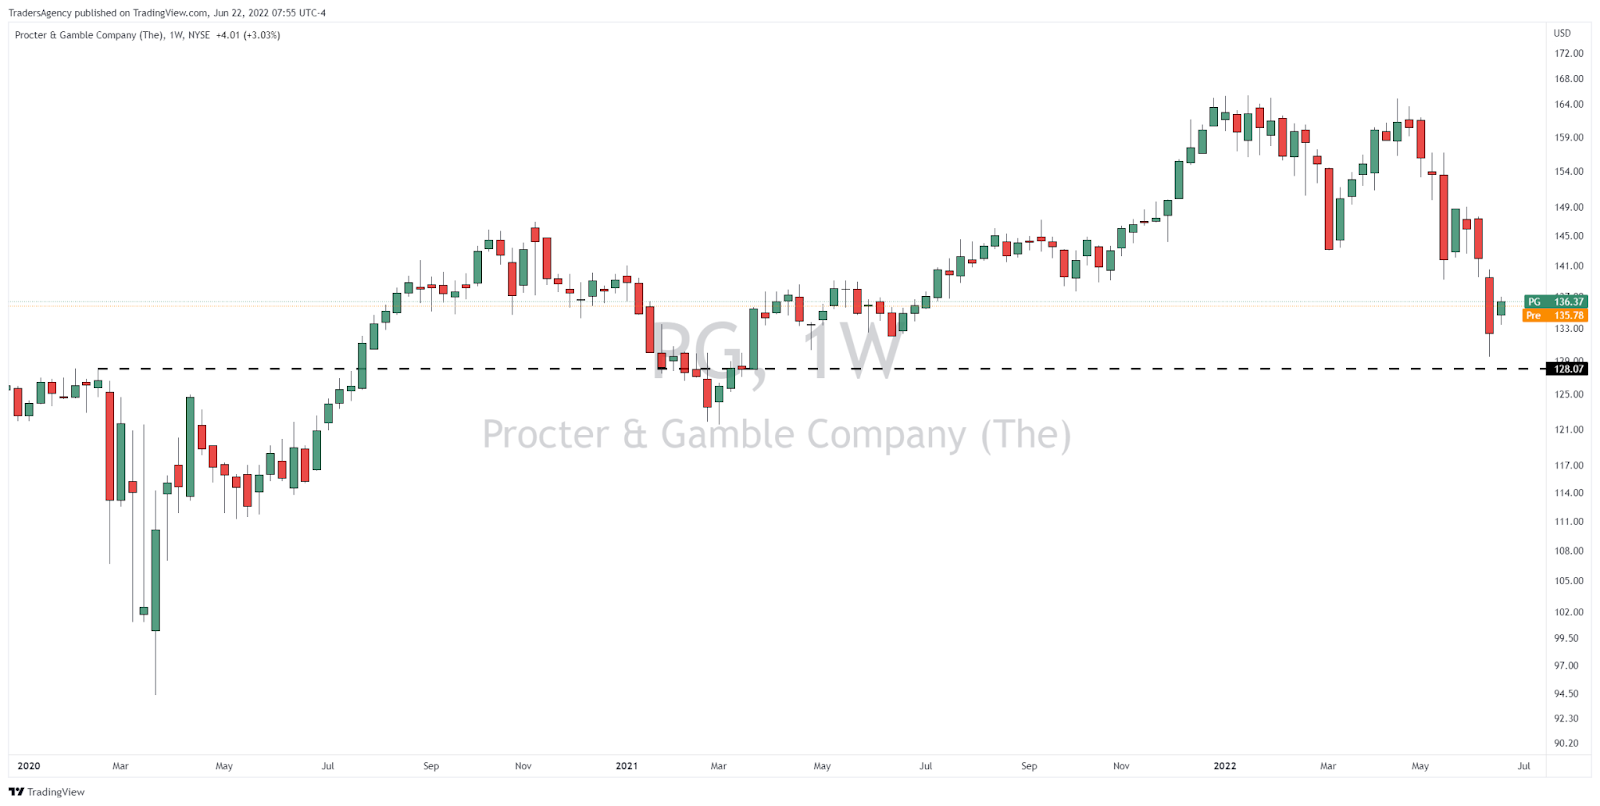
Procter & Gamble (PG) rose 75% from March 2020 to January 2022 but gave back 22% in just the last few months.
Interestingly, this stock tested its pre-pandemic high a few times back in 2021 while most stocks took off and never looked back until recently.
Micron Technology, Inc.
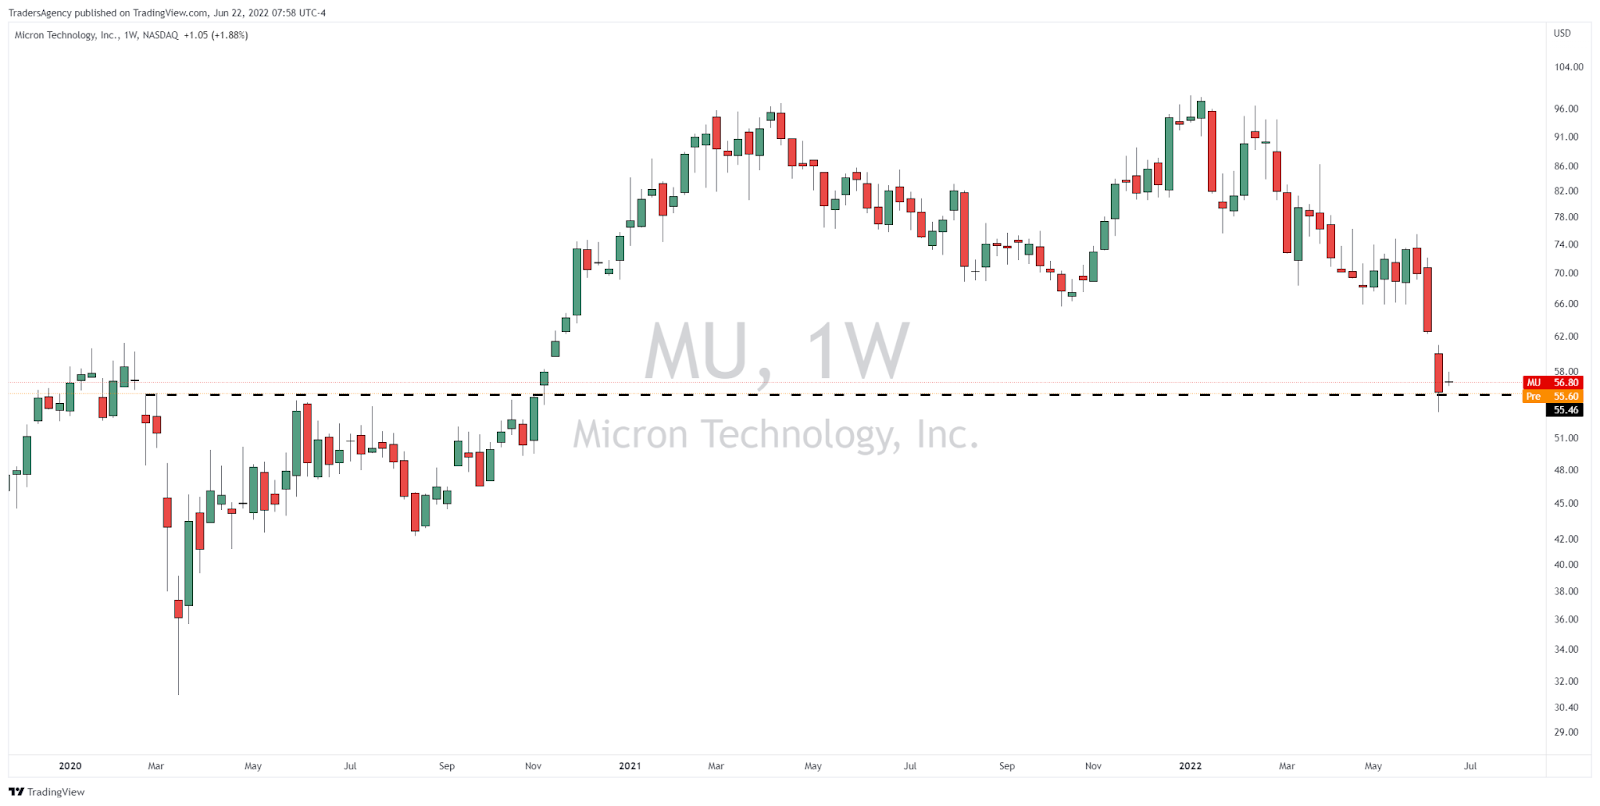
Micron Technology, Inc. (MU) saw a solid 216% gain during the course of its rally, but it’s down 40% or so this year as technology stocks have been shunned.
It’s now given up all of its gains since the 2020 breakout.
American Express Company
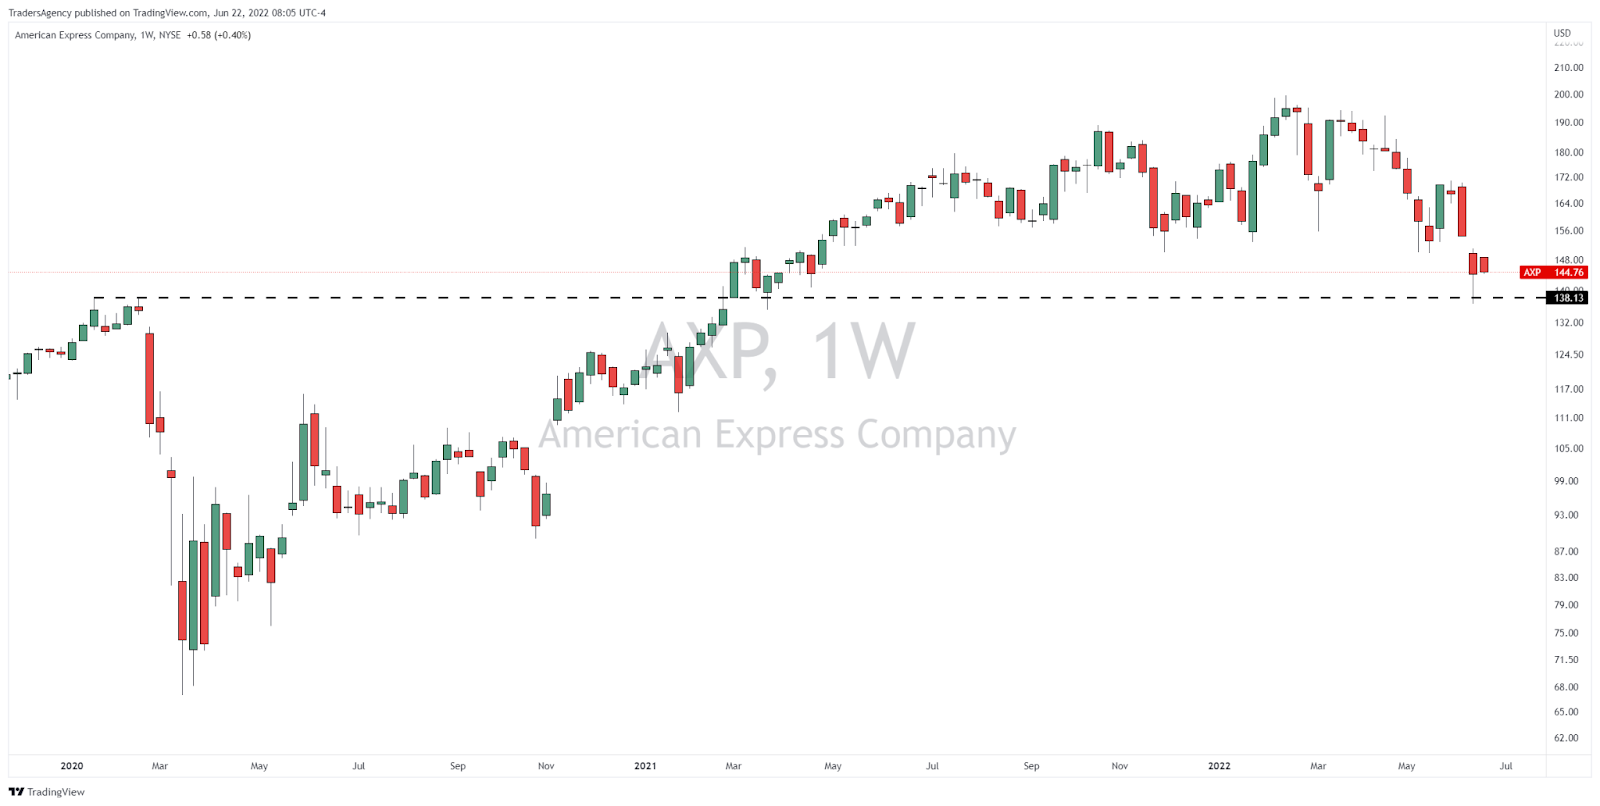
American Express (AXP) was up 198% from March 2020 through February 2022 but fell about 32% in the last few months.
The stock tested its prior highs last week and has bounced off of that level a bit since then.
Discover Financial Services
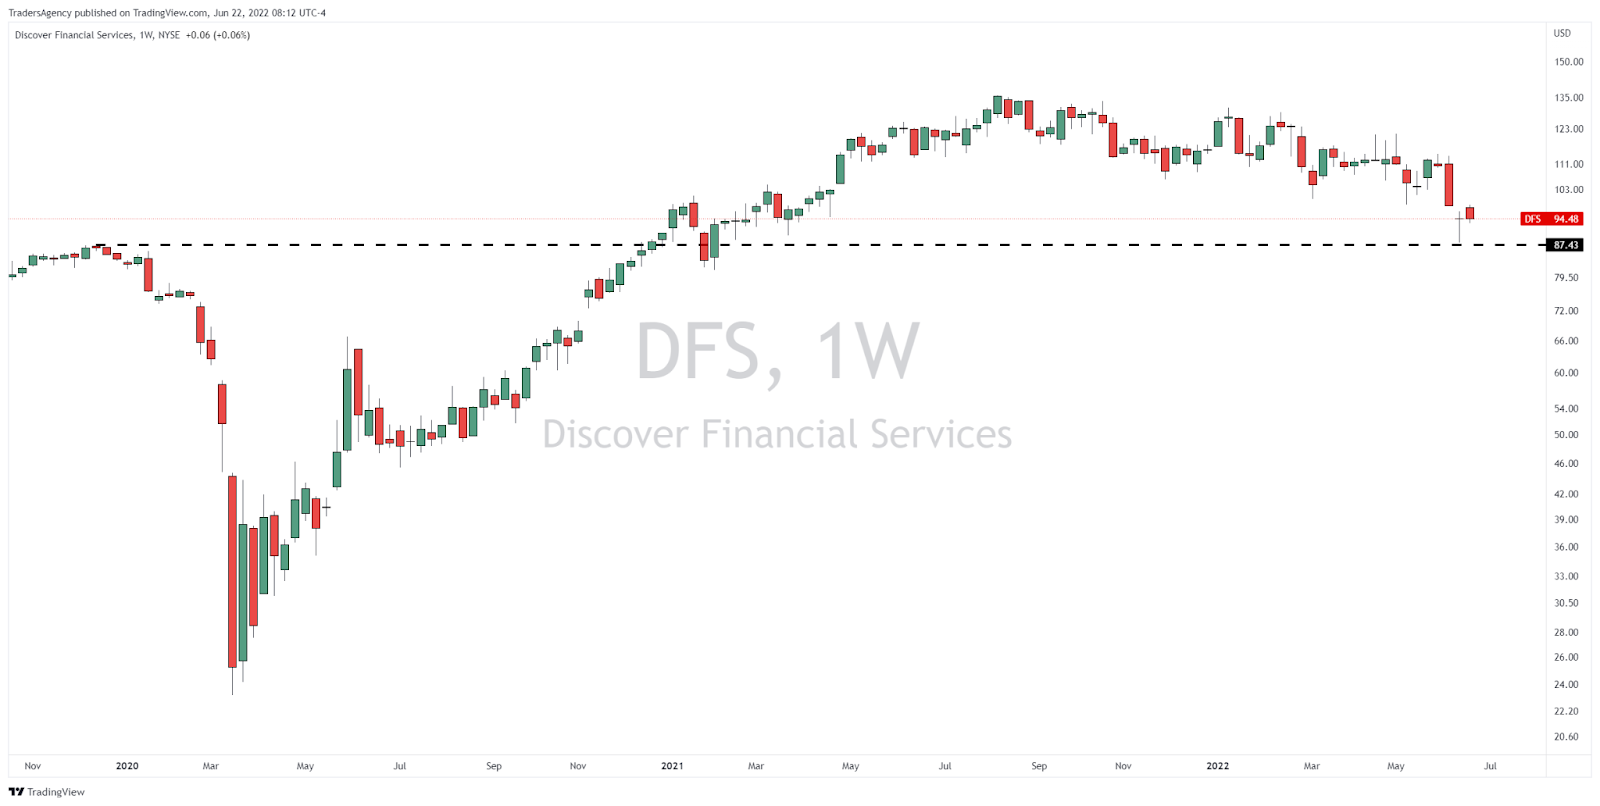
Last but not least is Discover Financial Services (DFS), which jumped a massive 484% from March 2020 to August 2021.
Like AXP, Discover tested its pre-pandemic high last week after falling 35% from the recent high and bounced slightly.
What’s Next?
Now, you can see that most of these stocks are larger-cap, blue-chip companies. They’re not the typical stocks we talk about in Stock Surge Daily most of the time.
However, I wanted to talk about them today because they may be able to give us clues about where we’ll see the bottom.
The S&P 500 Index is still about 8% above its pre-pandemic high, while the Nasdaq 100 is about 15% above its pre-pandemic peak.
Whether they get there is anyone’s guess…
But by watching how some individual stocks react at their own individual support levels, we might be able to get a heads-up as to what’s in store for the broader market.
Did You Miss the Big Reveal?
Were you able to join my colleague and expert trader Anthony Speciale yesterday for the unveiling of Project 6×6 and his brand-new trading service, Part Time Profits?
If not, you need to check the encore presentation right here!
Anthony revealed the exact “1% trading blueprint” he used to go from working day and night as an auto mechanic…
To banking $100,000+ in real trading profits six straight years in a row.
All by only logging on to his computer from the comfort of his home for 1-2 hours every week…
Click here to watch the full replay now!
Embrace the surge,

Ross Givens
Editor, Stock Surge Daily


