As regular readers know, we use different time frame charts for different purposes…
We look at monthly charts to determine the long-term direction.
We look at weekly charts to find the intermediate-term trend.
We look at daily charts to find the short-term trend, and so on…
90% of the time, I am watching daily charts of various stocks and indexes.
If I’m looking for a larger move, I analyze the weekly time frame.
But if you really want to drill down and buy with great precision…
I suggest using a five-minute chart as well.
The setup I look for involves shrinking volatility as price action tightens from the left side of the chart to the right.
It is a timeless approach based on supply and demand.
The Five-Minute Secret
After scanning for stocks with good fundamentals and high relative strength, I’m looking for a good setup on a daily chart with a low-risk entry point.
But if the same pattern shows up on a five-minute chart (which it often will), this is an even better sign.
Look at this daily chart of Iron Mountain Incorporated (IRM) for an example.
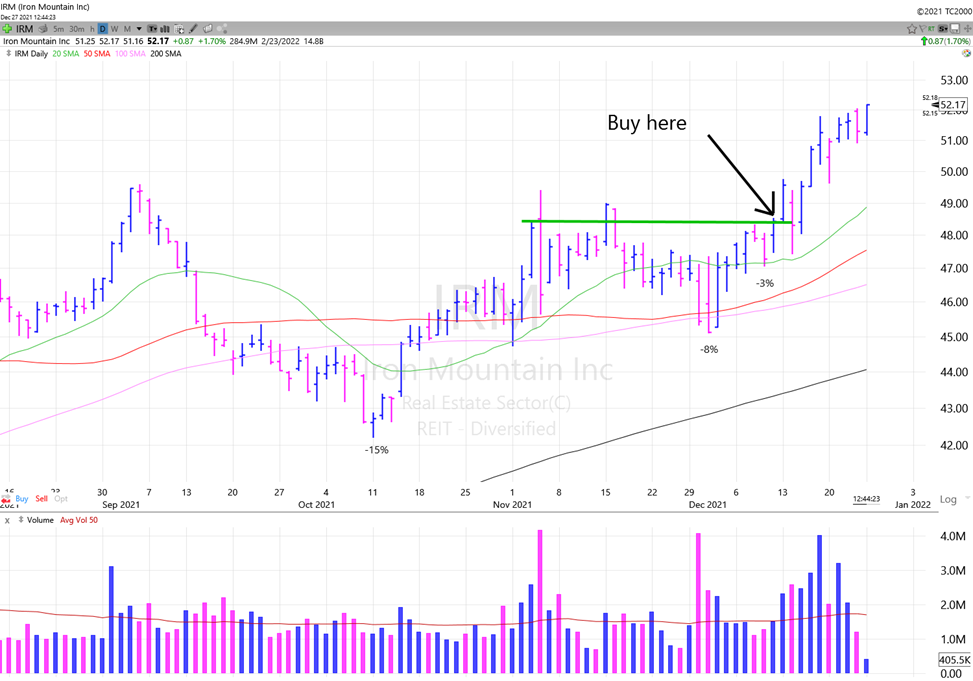
Pullbacks decreased from 15% to just 3% before breaking out two weeks ago.
But to get even more precise with your entry, go to a five-minute chart.
You want to see the same pattern emerging over the last one to five days.
Here’s how that looked with IRM…
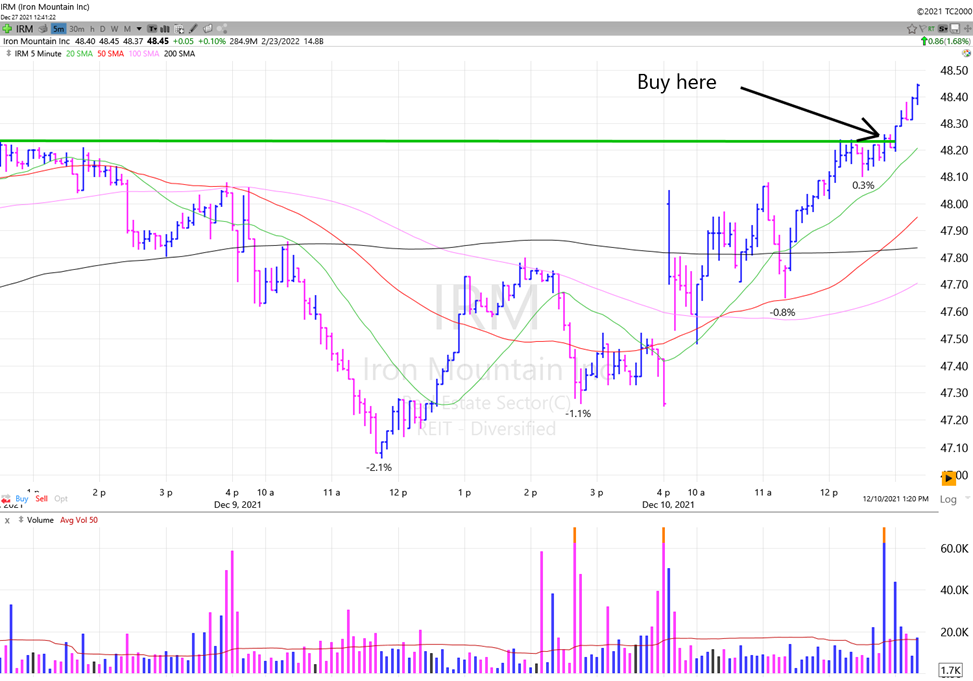
Look closely… It’s almost an exact replica of the daily chart!
Pullbacks compressed from 2.1% down to a miniscule 0.3%. This allows you to very precisely identify the exact buy point.
This won’t happen every time, though.
Sometimes the five-minute chart does not show the same pattern.
But when it does, I am a lot more confident in the trade.
Embrace the surge,

Ross Givens
Editor, Stock Surge Daily


