Hey, Ross here:
What do semiconductor and silver stocks have in common with each other?
The answer may surprise you.
Chart of the Day

This is an interesting chart from Morgan Stanley that shows how semiconductor stocks appear to be tracking the path forged by silver stocks four months ago.
Based on this chart…
You can expect that semiconductor stocks to chop around and falter as they sell off significantly.
Now, naturally you might ask – what relationship do semiconductor stocks have with silver stocks anyway?
Sure, silver is being used in AI data centers, so they’re not totally unrelated…
But most of the catalysts that move them are completely different.
For example…
Silver stocks are driven by things like precious metals demand, industrial usage, mining supply, real rates, and the dollar.
Semiconductor stocks are driven by AI capex, chip demand, data center spending, earnings revisions, and product cycles.
So because of that, I have seen a lot of people dismiss this chart out of hand.
I understand why.
And yet, my view is that the odds are that semiconductor stocks will likely follow the rough path traced by silver stocks four months ago.
I explain why below.
Insight of the Day
Crowded trades rhyme because trader psychology never changes
Silver stocks and semiconductor stocks obviously aren’t the same.
But crowded trades often behave the same way.
Once everyone piles into a hot theme, the underlying story starts to matter less in the short term.
What matters more is positioning.
Who already bought?
Who is late?
Who is trapped if the trade turns?
Who starts selling once momentum stalls?
That psychology repeats across different sectors.
Silver. Semiconductors. AI. Energy. Small caps.
Different catalysts…
Same human behavior.
And ultimately, human behavior is what drives market prices.
That’s why I’m not looking to blindly chase the old leader here.
If semis are about to chop, stall, or pull back…
The better opportunity is finding the next clean breakout setup before the crowd crowds into it.
That’s exactly what I’ll be breaking down in today’s LIVE briefing at 3 p.m. Eastern…
My #1 breakout chart pattern for spotting these setups before they become obvious.
You see, chart patterns work for the same reason this semiconductor/silver analog matters:
They reveal trader psychology.
Fear… greed… exhaustion… accumulation…
The moment sellers start losing control and buyers start pressing again.
And it’s not just my personal #1 pattern…
It’s a pattern that was ranked no. 1 in both bull and bear markets by the guy who literally wrote the book on chart patterns…
And it’s helped us get the shot at gains like 70% in 10 days…
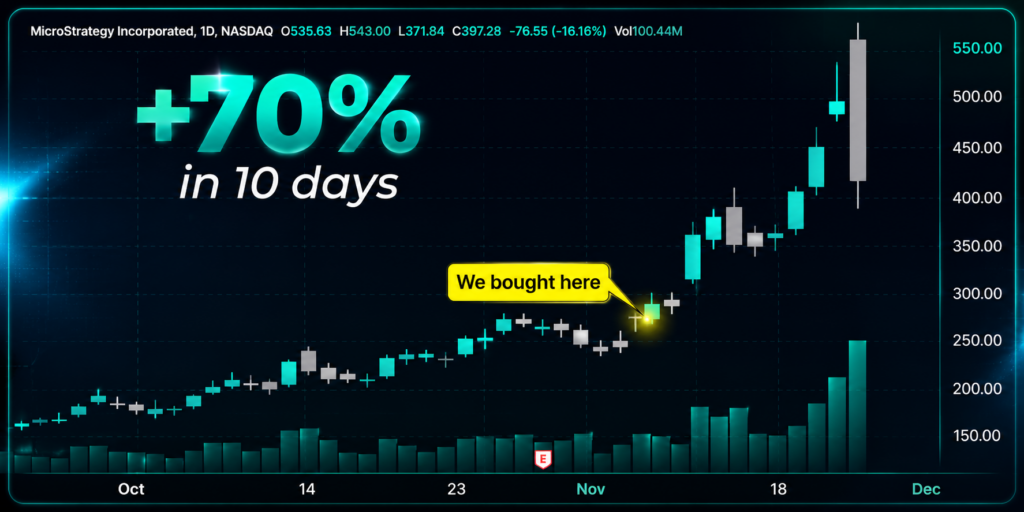
114% in 4 days…

And even 148% in just 2 days:
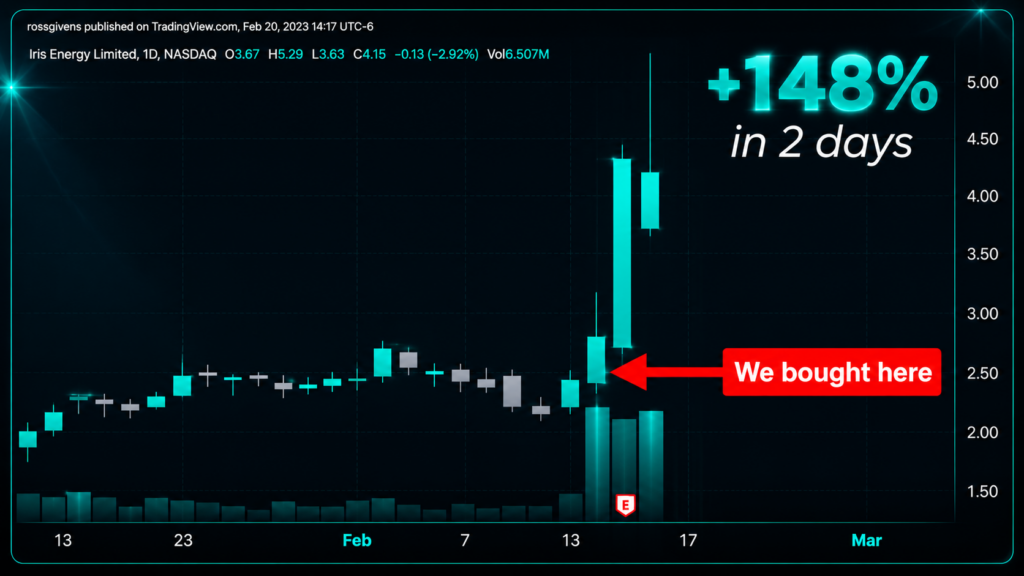
Later today, I’ll be sharing all the details about this prophetic pattern…
Including the name and ticker of a stock that’s setting up for a potentially massive move right now.
It’s free to attend, but seating is limited and we expect a packed house…
So click here to guarantee your free spot if you haven’t yet…
And I’ll see you later today at 3 p.m. ET.
Don’t be late.
P.S. If you’re planning to attend on a mobile device, make sure you download the presentation app now so you don’t miss anything when it starts. See you there.
iOS: https://apps.apple.com/us/app/goto/id1465614785
Android: https://play.google.com/store/search?q=goto&c=apps
Customer Story of the Day
“Fantastic! Doing well investing with Traders Agency and Ross Givens.
Best decision I have made on this investing journey. Thanks.”

Ross Givens
Editor, Stock Surge Daily