Hey, Ross here:
With the market still near all-time highs despite everything that’s going on…
It’s worth taking a step back to ask – just how much juice is left in this bull?
Chart of the Day
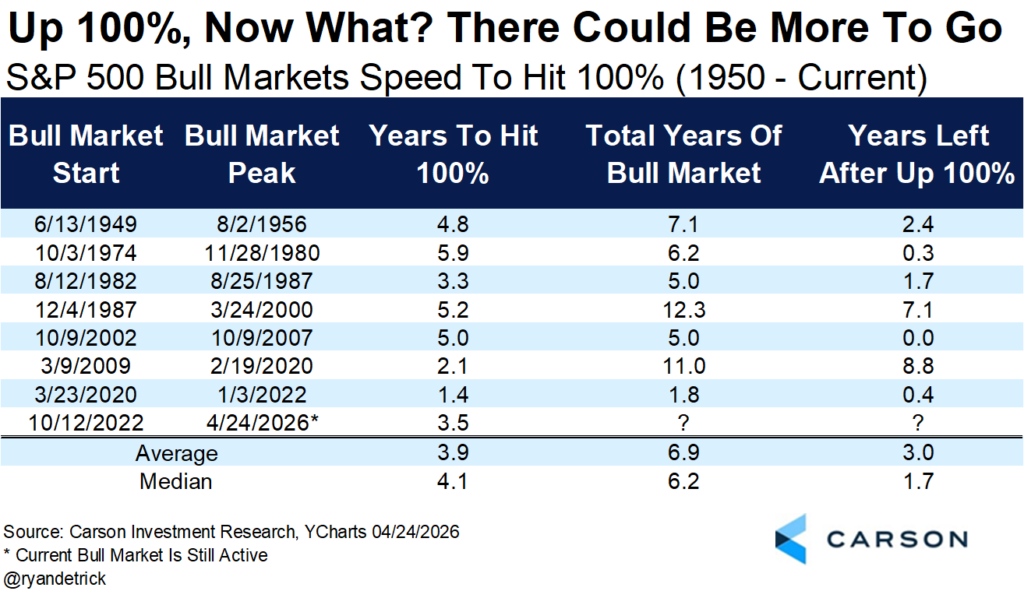
This chart shows all the past bull markets, dating back to 1950, where the S&P 500 has at least doubled.
For each one, it breaks down how long it took to double, the total length of the bull market, and how many years the bull market kept running after the S&P 500 doubled.
And as the data shows…
The average bull market runs far longer than most people expect – 6 to 7 years on average.
It also takes about four years for the S&P 500 to double – meaning there’s about 3 years left in the average bull market even after the S&P 500 has doubled.
Right now, the S&P 500 has just about doubled from October 2022 – 3.5 years ago.
If history is any indication, there’s still quite a ways left to go.
And this leads us to an important insight below.
Insight of the Day
Don’t be afraid of buying stocks at new highs.
Many traders are skeptical of buying stocks at new highs.
They associate it with “irrational exuberance”…
With clueless investors snapping up hyped-up stocks – right before a big drop.
All that does indeed happen from time to time.
But remember, the stock market tends to go up over time…
Which naturally means you will naturally be buying stocks that are at new highs.
And while you should always be cautious – you don’t want to avoid these stocks.
Take a look at the chart below.
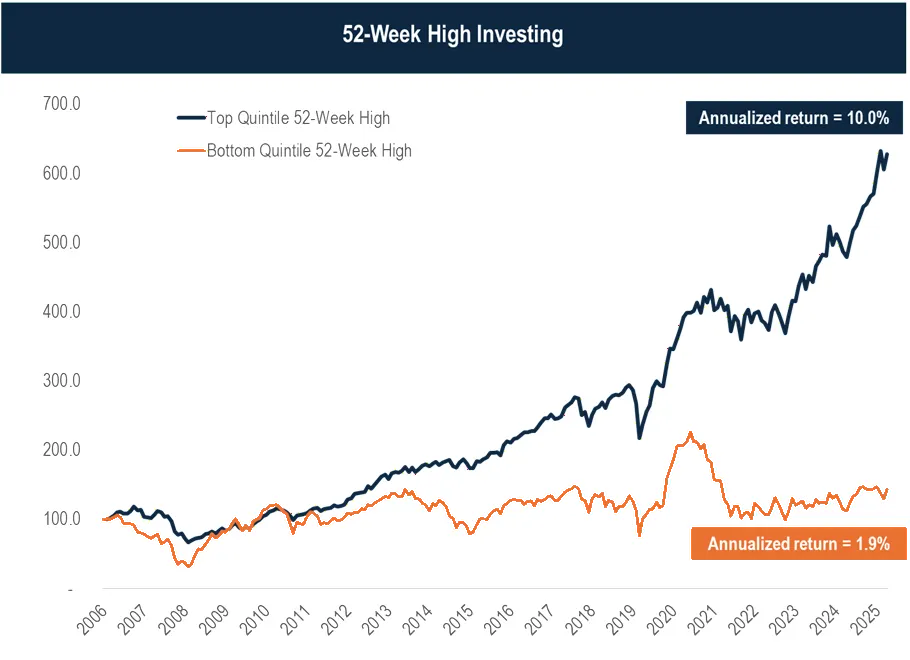
The blue line are U.S. stocks that are closest to their 52-week highs…
While the orange line are stocks that are furthest away from their 52-week high.
As you can see, the stocks that are closest to their 52-week highs delivered 5X the returns as those furthest away.
Like I said, don’t be afraid of buying stocks at or close to new highs.
Oftentimes, they’re actually a far better bet than the opposite.
Now, you may have noticed in the chart above, the 52-week high stocks returned a paltry annualized return of just 10%.
While better than their opposites, that’s just a mediocre return.
You can’t just buy a stock at new highs and expect a decent gain.
You need to be far more specific with your targeting.
That’s why, yesterday afternoon…
I released a free video showcasing two top trades I’m targeting right now.
If you haven’t seen it yet – click here to do so now.
Customer Story of the Day
“THE best investing and trading experience ever !! Ross and his team go beyond everyone else and make you richer !!”
Embrace the surge,

Ross Givens
Editor, Stock Surge Daily


