In yesterday’s issue of Stock Surge Daily, I showed you how I’ve been trading the move in Tesla, Inc. (TSLA) stock.
This is one of the more volatile stocks out there, so I decided to scale into a position with two separate entries.
I made my first half-sized entry as the stock was beginning to break out of a multi-month consolidation period.
And I made my second half-sized entry as the stock began tightening up again after its initial surge.
I ended up with a slightly higher average cost on this trade by scaling in at a higher price on the second entry…
But given the stock’s volatility, I didn’t want to buy a full position all at once and take the risk of the stock moving against me.
In other words, paying a slightly higher price overall was worth it to avoid the extra risk.
And that brings me to my trade in AMC Entertainment Holdings, Inc. (AMC), another highly volatile stock, which I first told you about in your Aug. 19 issue.
My Trade in AMC
After a big run up in price during the first half of 2021, shares of AMC consolidated and gave me a low-risk entry point.
You can see my initial entry in the chart below. I bought a small pilot position near $37.00, and I set a stop at the bottom of the consolidation range at $28.85.
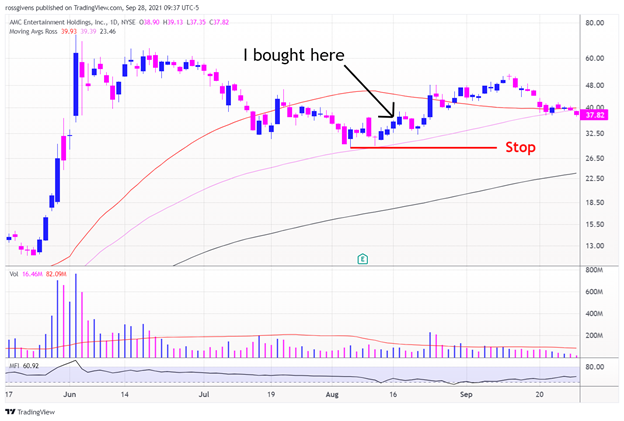
A few days after my initial entry, the shares began to surge. AMC was up 30% in just a week.
But I didn’t get the huge follow-through move I was hoping for.
Shares began to roll over and are now back near the original breakout level around $37.00.
But price action is once again getting quiet.
This is a good sign. It means that volatility is calming down, and we could get a new entry point.
Volume has also been well below average for the last several trading days.
This is often an indication that sellers are drying up and the stock has been concentrated into stronger hands, or “diamond hands” as the Reddit crowd would say.
What the Chart Tells Me
When analyzing a stock chart, I like to use my imagination…
This helps me to visualize what I expect to happen and plan my attack.
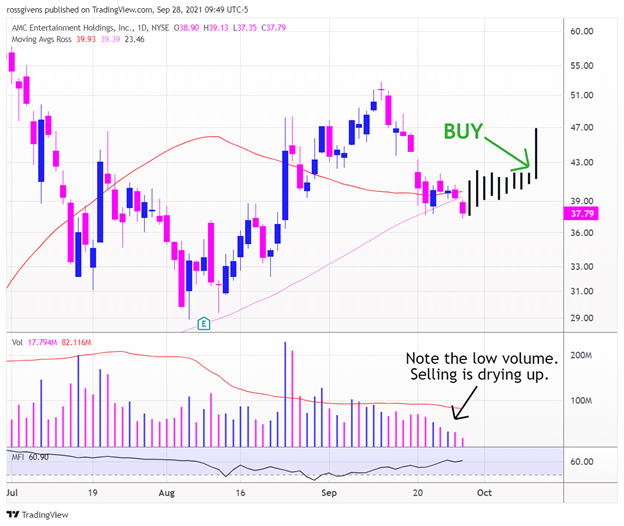
As you can see, I’ve drawn out the setup above.
While there are no guarantees in the market, this is what I would love to see happen over the next week or two.
If price continues to tighten and volume stays low, I will be looking to buy on a fresh breakout near the $42 area.
Of course, anything can happen…
If AMC breaks down or gaps way up, I’ll sit on my hands and wait for a new opportunity.
But for now, this is my plan of attack.
I’ll be sure to keep you posted as the setup develops further.
Embrace the Surge,


