Well, yesterday was yet another down day for stocks as markets continue to struggle to get out of this current rut they find themselves in.
Now, I write that sentence with the full understanding of just how far the markets have actually come over the past year.
Yet, despite the great progress made when looking at the big picture, markets are still not in the position we as investors are hoping they might reach.
With all major indexes down and many individual names suffering big losses, investors like us can’t help but wonder just how bad things could really get.
The truth is, at this early stage, it’s really impossible to say for sure just how far down the rabbit hole we may fall.
Things could (and hopefully will) get much better, or charts could continue trending downwards, leaving many investors wondering where they went wrong.
If things do manage to break down hard and it starts looking like it’s time to go short, there’s one index in particular I’m going to go with…
Shorting IWO
Right now, two key areas of the market are underperforming.
First, the small-cap stocks of the Russell 2000 index have been mostly flat for almost a year now.
At the same time, we are currently seeing a rotation out of growth stocks with high price-earnings (PE) multiples.
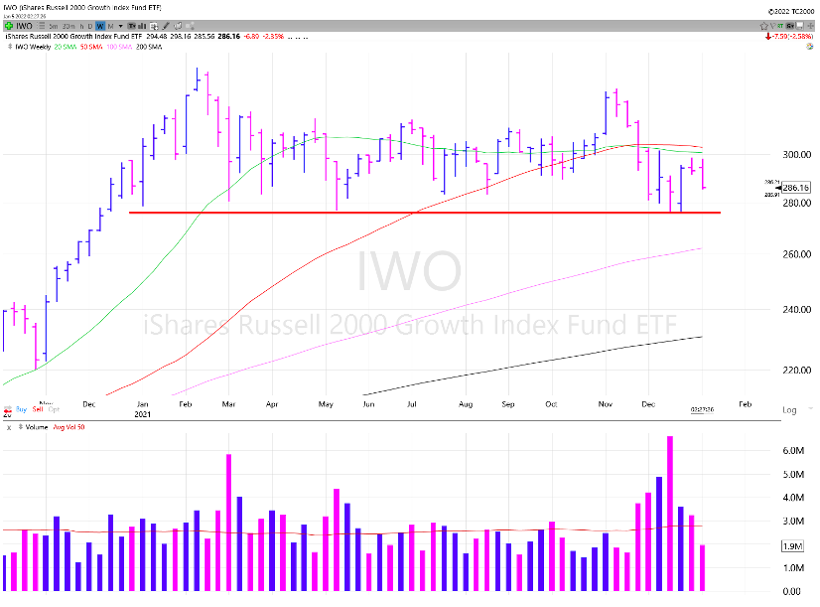
Well, the iShares Russell 2000 Growth ETF (IWO) is a growth-focused exchange-traded fund (ETF) that represents the two areas seeing the most underperformance right now…
Small-cap stocks and growth stocks!
And based on the support line drawn in red on the chart above, if IWO gets below $275, things could get ugly really quickly.
That means it’s a prime candidate for investors looking for a short opportunity in the days to come.
After all, when looking to short a company, we’re actually looking for it to trend downwards so that we can benefit from its demise.
Hey, nobody said Wall Street was a nice place to work…
Putting It In Perspective
To put this into perspective, take a look at the chart below which covers the major indexes over the last 12 months.
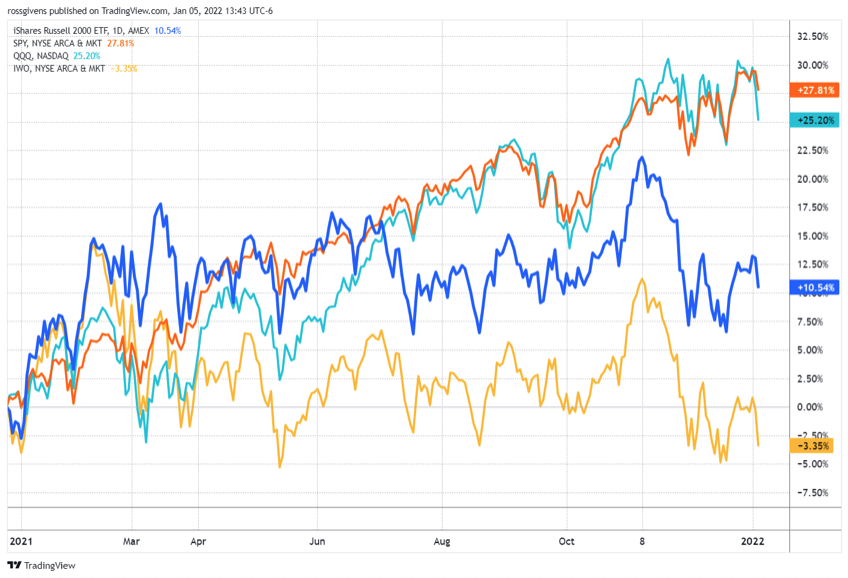
When dissecting the information included in the image above, we can clearly see that the IWO (the yellow line on the chart) is the only one in negative territory.
And for investors like us who might be looking to make a move on a downward spiraling stock or sector, that’s just the type of weakness we’d be looking for.
Embrace the surge,

Ross Givens
Editor, Stock Surge Daily


