Hey, Ross here:
Stocks have had a rough stretch.
After the run we had before that, some selling was probably overdue.
But now that the pullback has lasted a few days, I’m watching something more important than whether the S&P finishes red again today.
I want to know how far the weakness is spreading.
Take a look:
Chart of the Day
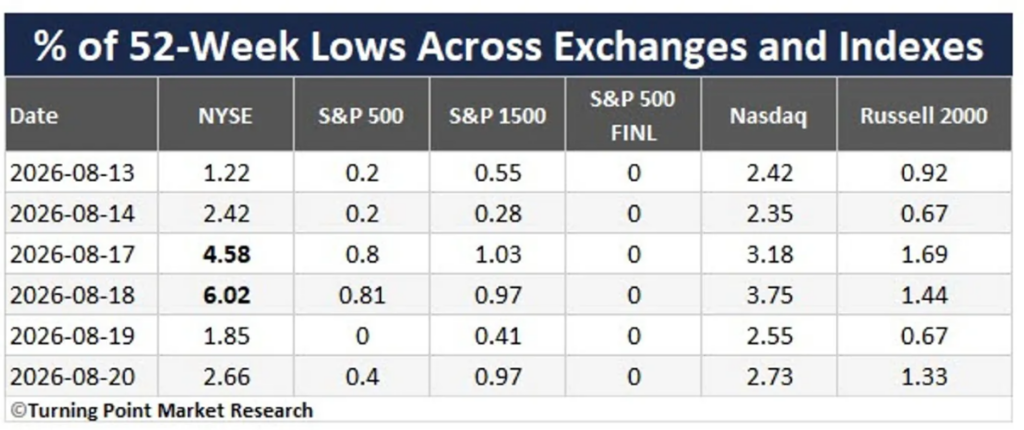
This tracks the percentage of stocks making fresh 52-week lows across several parts of the market.
The NYSE saw a noticeable jump earlier this week.
But elsewhere, the numbers are still pretty tame.
As of the latest reading:
- Just 0.4% of S&P 500 stocks were at 52-week lows.
- The S&P 1500 was under 1%.
- The Russell 2000 was around 1.3%.
So yes, stocks have been selling off.
But we haven’t seen large numbers of companies suddenly fall apart underneath the indexes.
This next chart backs that up.
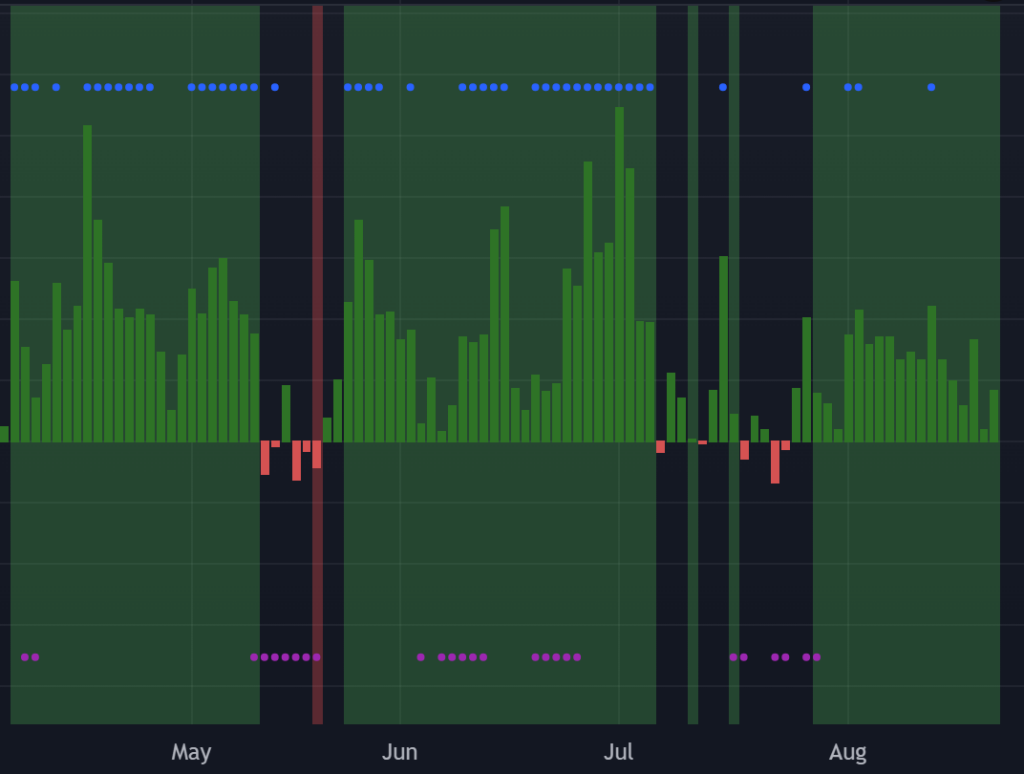
The bars here compare stocks making new highs with those making new lows.
Green means new highs are winning.
Red means new lows are taking over.
And even after the recent weakness, the latest reading is still firmly green.
So we’ve had a rough stretch in the indexes…
But underneath them, plenty of stocks are still pushing higher.
Now here’s one more piece of the picture:
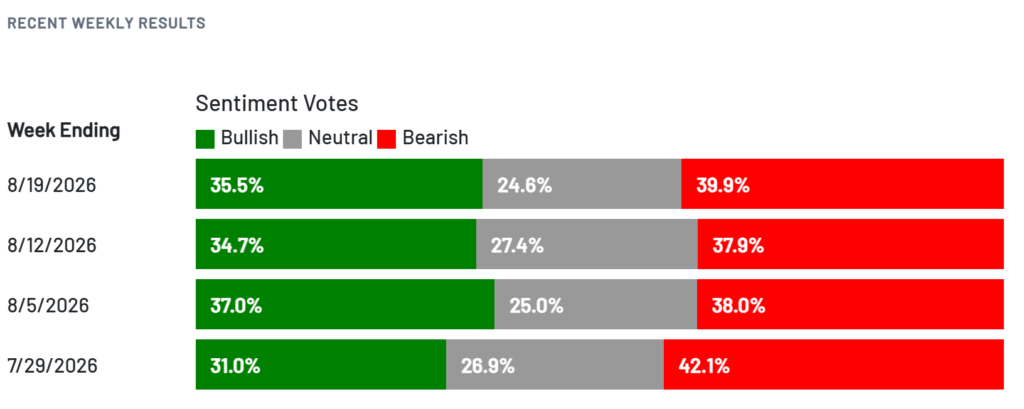
Individual investors aren’t exactly feeling great about it.
In the latest AAII survey, 39.9% were bearish versus 35.5% bullish.
And bears have outnumbered bulls for several weeks now.
So despite the market holding up reasonably well beneath the surface…
The average investor is still pretty skeptical.
I actually prefer that to everyone piling onto the bullish side at once.
More importantly, it tells me this pullback has shaken sentiment a lot more than it has shaken breadth.
And that’s the part I’d keep watching from here.
I explain below.
Insight of the Day
Corrections need participation too.
A real correction usually doesn’t stay isolated.
The selling spreads.
A few weak stocks become dozens.
Dozens become hundreds.
More support levels break.
More stocks start making fresh lows.
Eventually, you stop looking at a handful of problem areas and start seeing weakness almost everywhere.
That’s why I don’t put too much weight on the number of consecutive red days by itself.
I want to see whether the rest of the market is joining in.
So far, it really hasn’t.
New lows remain fairly contained.
And we’re still seeing a healthy number of stocks making new highs.
That doesn’t mean I’m calling the bottom here.
If the selling keeps going and those numbers start deteriorating, I’ll adjust.
But until then, I’m not going to treat every pullback like the start of a major correction.
P.S. America just made a massive $2 trillion gamble. Here are 3 stocks that could profit.
Customer Story of the Day
“I have learned an incredible amount of how to trade”

Ross Givens
Editor, Stock Surge Daily