Hey, Ross here:
Yesterday, I showed you how the big money is rotating between sectors.
Today, the split goes even deeper.
Because stocks sitting inside the same sector are no longer moving together either.
Chart of the Day
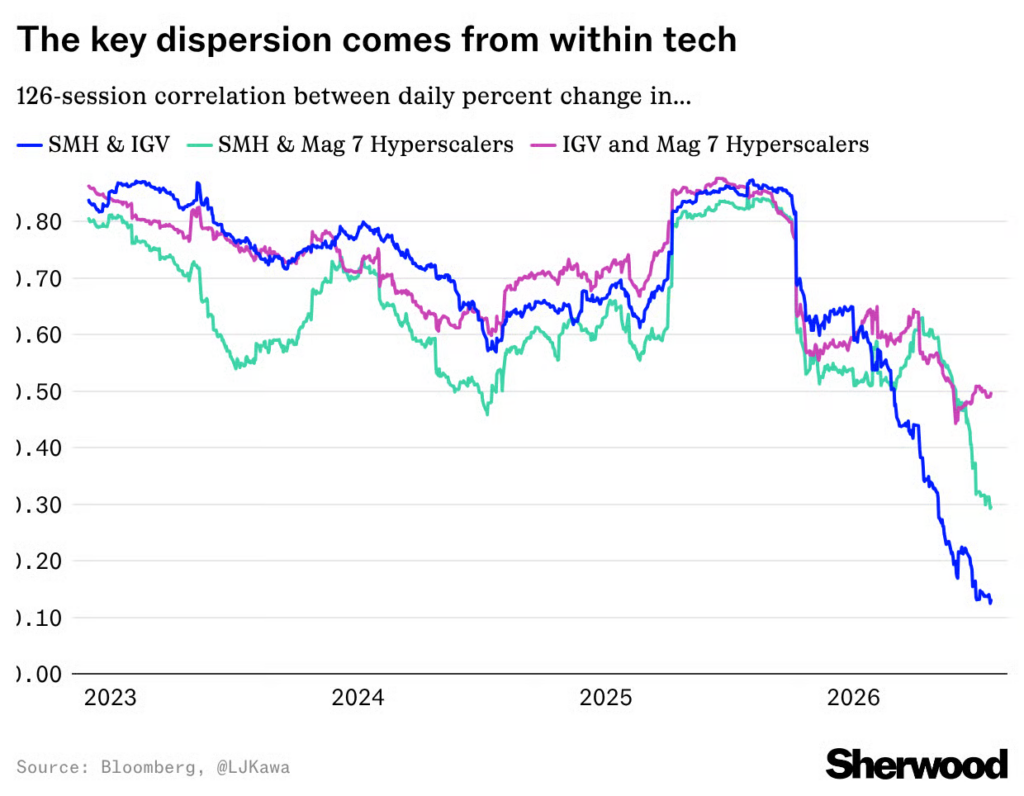
Take a look at this first chart.
It compares how closely three major corners of tech have been trading:
Semiconductors…
Software…
And the giant hyperscalers spending billions on AI.
Normally, these groups move in roughly the same direction.
But lately, that relationship has broken down.
Their correlations have plunged toward the lowest levels since 2017.
In plain English, the “tech trade” is splintering.
One group can rip higher…
While another gets hammered.
And that makes this next chart even more interesting.
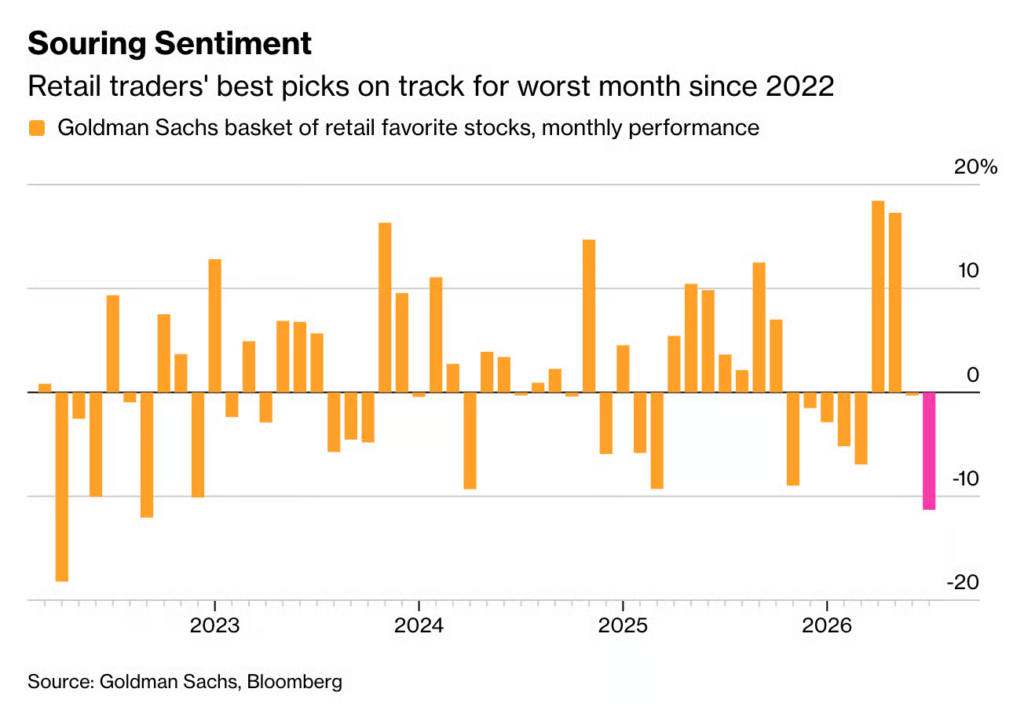
It shows the monthly performance of the stocks most popular with retail traders.
And this month, that basket is heading for its worst performance since 2022.
So while retail traders remain clustered around the same familiar names and stories…
The market is drawing much sharper lines between the winners and losers.
And moves this large usually require serious buying power.
Individual traders can chase a stock.
But the giant funds are the ones capable of pushing millions of shares through the market and driving a sustained move.
I explain below.
Insight of the Day
The big funds don’t just find the winners. Their buying helps create the move.
What you’re seeing in those charts is a market getting more selective.
Stocks tied to the same theme are no longer moving together.
Some are holding up. Others are getting crushed.
And moves that large usually require serious buying power.
An individual trader can buy a few hundred shares.
Maybe a few thousand.
But when a hedge fund, pension fund or mutual fund decides to build a position…
It may need to buy millions.
And it cannot buy them all at once.
If it did, the stock would rip higher before the fund finished buying.
So the fund builds its position over time.
It buys on pullbacks.
It absorbs shares from sellers.
Then it keeps buying as more supply hits the market.
That steady demand can support one stock for weeks – even while similar companies fall apart.
This is why the broad theme can look weak while one stock refuses to break.
It is also why one company can suddenly pull away from the rest of its sector.
The big money is concentrating its capital there.
And that buying leaves footprints.
Volume starts building.
Pullbacks get bought quickly.
The stock holds up while its peers roll over.
Then, once enough shares have changed hands, the move can accelerate fast.
That is what I’m looking for.
Not just a popular story or a hot sector.
I want the specific stocks where institutions may already be building positions large enough to move the price.
And later this morning at 11 a.m. Eastern…
I’m going LIVE to demonstrate the strategy I use to track these “smart money” footprints right into these specific stocks.
It is the same strategy that has helped us find moves of:
155% in 150 days…
212% in 165 days…
424% in less than six months…
Even 524% in 13 months.
I’ll show you what those footprints look like…
Why they appear…
And how I use them to find stocks that may be preparing to break away from the pack.
The session is free, but the room is expected to fill quickly.
So click here to lock in your seat now if you haven’t yet…
And I’ll see you shortly at 11 a.m. ET.
P.S. If you’re planning to attend on a mobile device, make sure you download the presentation app now so you don’t miss anything when it starts. See you there.
iOS: https://apps.apple.com/us/app/goto/id1465614785
Android: https://play.google.com/store/search?q=goto&c=apps
Customer Story of the Day
“I’ve been an extremely happy customer for over a year. I’ve doubled my money and would have made more money had I not ventured off and did my own thing. (a learning experience, but much wiser now).”

Ross Givens
Editor, Stock Surge Daily