Hey, Ross here:
The market may have pulled back a little yesterday, but upward momentum is still strong.
Underneath the surface, breadth continues to improve – and things are looking good.
So today, let’s look at a couple charts that point toward where the next sector to breakout could come from.
Chart of the Day
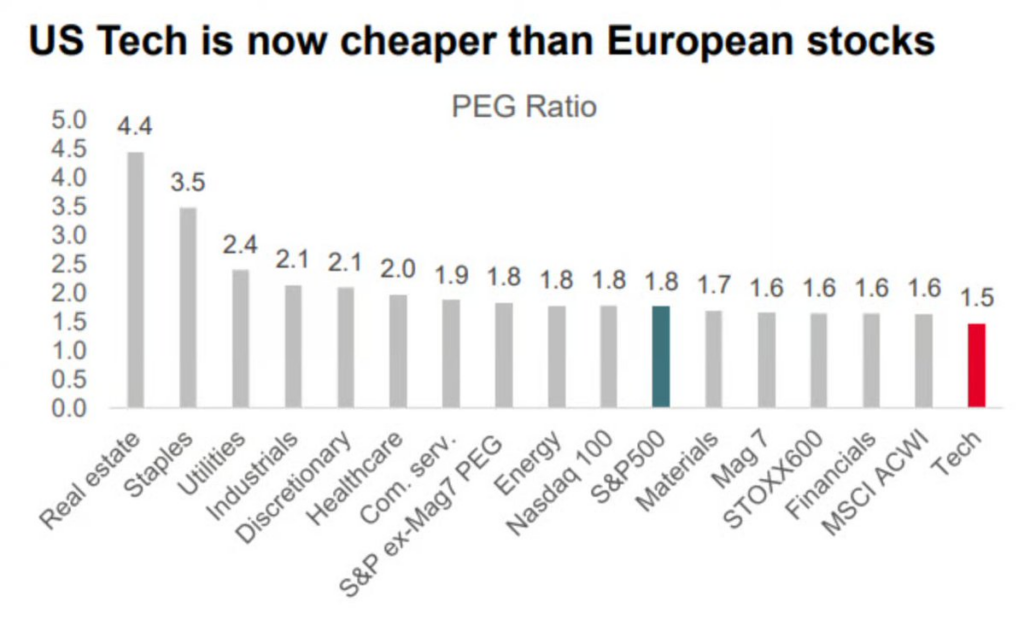
The first chart is valuations – price versus projected earnings growth (the PEG ratio).
Tech is still expected to drive the majority of earnings growth, but this is not reflected in the price.
In fact, as the chart shows, based on the PEG ratio…
The tech sector is trading cheaper than almost every S&P sector as well as the “lagging” European stocks.
So it’s perhaps no surprise that hedge funds are aggressively snapping up tech stocks at the fastest pace in weeks.
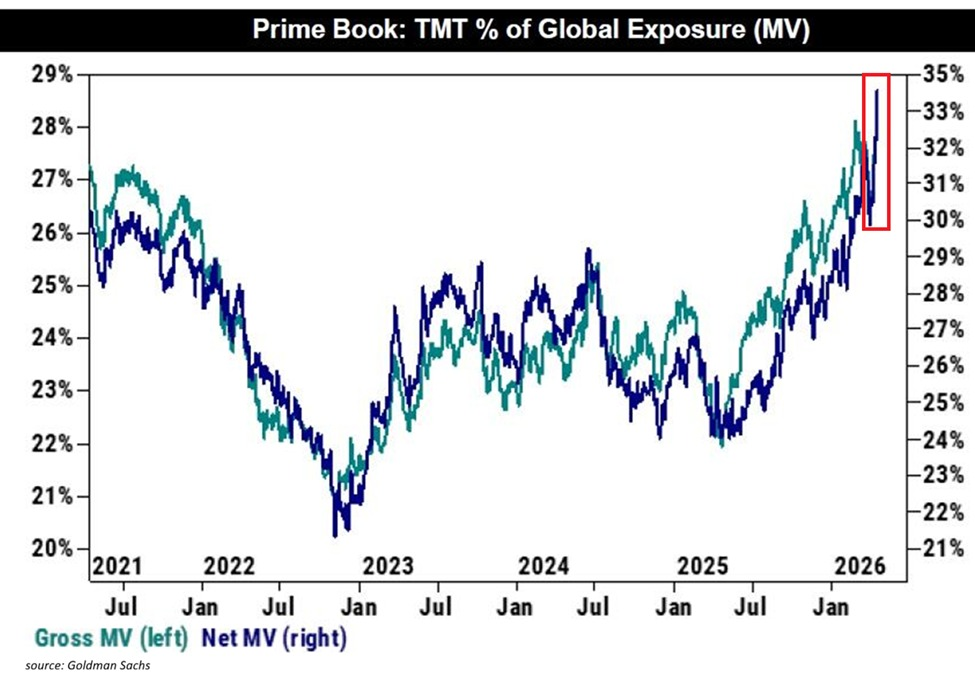
Oh, and this isn’t short covering by the way.
This buying is mainly comprised of new long positions.
In other words, it’s genuine institutional demand.
As I pointed out last week, PSCT – the Small-Cap Information Technology ETF – has already broken out.
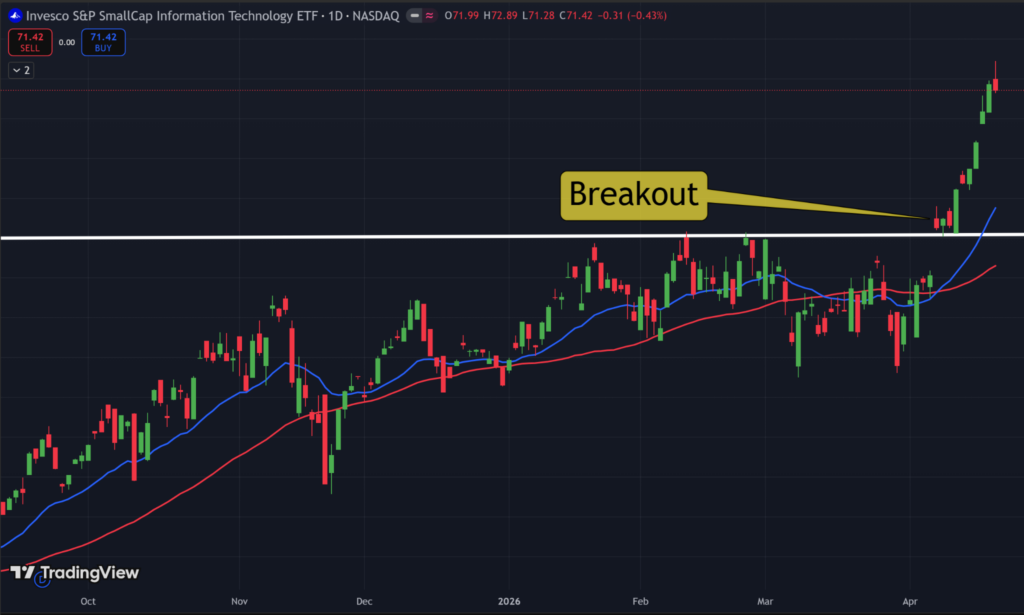
And now, it looks like other parts of the tech sector could follow.
Now, am I suggesting you go out and buy every tech stock you can find?
Of course not – it’s a lot more nuanced than that.
And that leads us to the Insight of the Day below.
Insight of the Day
You want to target stocks in the “reloading” phase.
The best gains are concentrated at the beginning of breakouts.
Meaning if you miss the early stages of the breakout – you’ve missed most of the gains.
That’s just how it is.
That’s why you want to target stocks that are in what I call the “reloading” phase.
Think of it like pulling a slingshot back before letting it loose.
At that point, it has maximum potential energy – which is about to be converted into kinetic energy.
That’s when we want to strike.
In stocks about to break out, we can determine this point by looking for a very specific kind of pattern.
I’ve personally used this pattern to help us identify wins like 163% in seven weeks…
270% in 10 weeks…
And a massive 177% in just 11 days.
And later this afternoon at 3 p.m. Eastern…
I’m going LIVE to show you exactly how to use this pattern for yourself.
I’ll break down the specific criteria to look for…
The false alarms…
And give you step-by-step instructions on identifying this pattern in any stock.
My live breakdown is free, but spots are limited.
So click here to guarantee your seat if you haven’t already…
And I’ll see you later this afternoon at 3 p.m. ET.
I’m seeing plenty of stocks exhibiting this pattern right now.
Let’s go after them together.
Customer Story of the Day
“By FAR !! the best way to understand the workings in the stock market. Ross and the team are the real deal, no BS.
I’m a lifetime full subscription member and couldn’t be more satisfied.”
Embrace the surge,

Ross Givens
Editor, Stock Surge Daily


